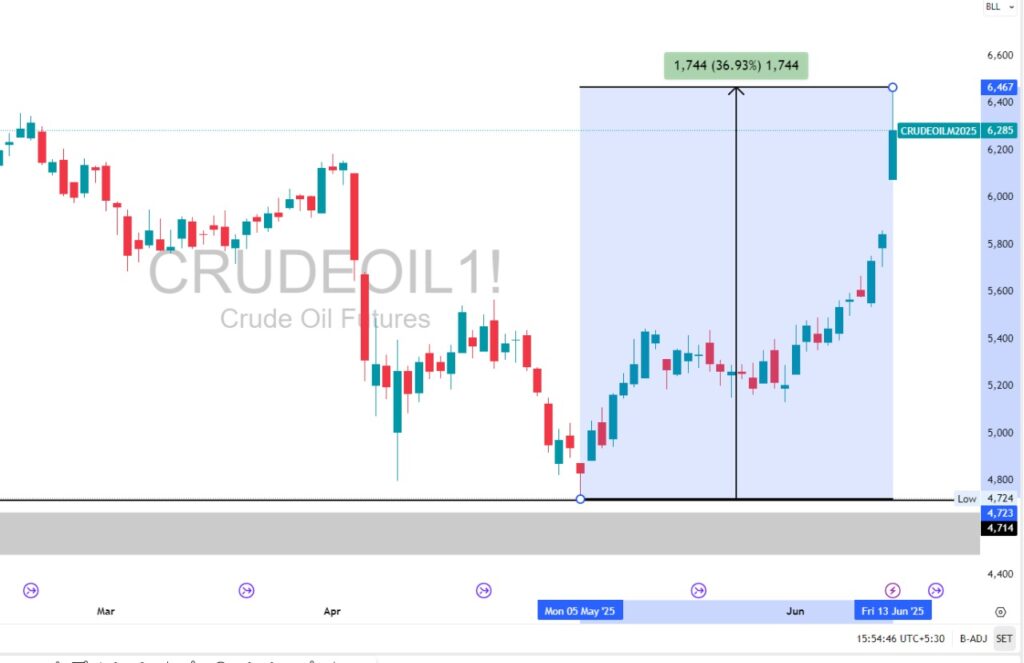
Crude oil prices have recently taken traders and investors by surprise with a stunning 36.93% rally in just over a month. From ₹4,724 on May 5, 2025, to ₹6,467 on June 13, 2025, MCX Crude Oil Futures surged nearly ₹1,744, delivering one of the most powerful commodity rallies seen in recent months.
This upward price movement is more than just numbers on a chart; it is a shift in market sentiment, altered fundamentals, and greater speculative activity. If you are any trader, investor, or market watcher, then this move holds lessons for you in price action, global macro trends, and trading psychology.
What Triggered the Spike in Crude Oil?
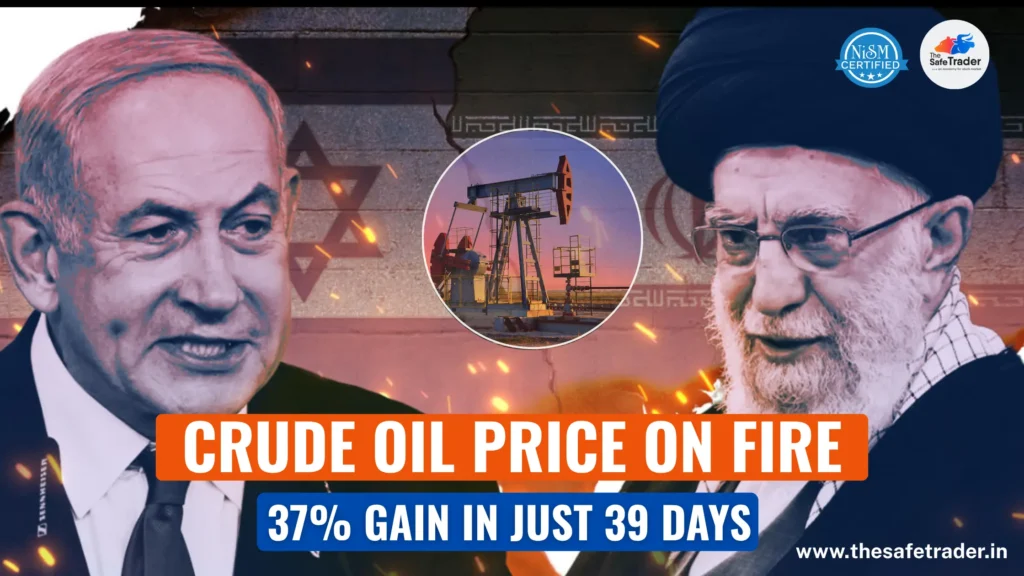
1. Middle East Geopolitical Tensions
One of the main catalysts has been the escalating conflict between Israel and Iran. With the potential for disruptions in oil flow through the Strait of Hormuz — a key artery for global oil exports — traders and institutions rushed to hedge their positions, sending oil prices soaring.
Fact: Nearly 30% of global crude oil passes through the Strait of Hormuz daily. Any instability here directly threatens global oil supply.
2. Restrained Supply-Restraint Factor on Price & OPEC+ Competition
Demand is consistently higher, while OPEC+ units, showing production restraint, refuse to drain the markets at these higher prices. The unplanned production outages in Libya and Nigeria also negatively affect supply.
3. Seasonal Demand Surge
The season of baby travel is soon upon us; hence higher gasoline and diesel consumption levels will be recorded. Refineries are now upping crude lifting to meet this seasonal demand, adding to the tight supply situation.
4. Speculative Buying & Technical Momentum
The price action seen in this rally also reflects momentum-driven trading. Once crude broke past resistance levels, traders using technical indicators likely added fuel to the rally:
- Breakout above resistance at ₹5,500 opened the door for ₹6,000+
- Moving average crossovers and bullish RSI likely attracted algorithmic and institutional buyers
Technical Analysis Breakdown
From a chartist’s perspective, this rally is a textbook example of trend reversal and breakout momentum. Here’s the breakdown:
| Feature | Detail |
| Lowest Point | ₹4,724 (on May 5, 2025) |
| Highest Point | ₹6,467 (on June 13, 2025) |
| Total Gain | ₹1,744 |
| Percentage Gain | 36.93% |
| Trend Pattern | V-shape recovery with higher highs & higher lows |
| Volume Analysis | Increasing volumes confirming bullish strength |
The breakout above previous resistance zones, followed by strong bullish candles, indicates high conviction buying in the market.
Key Takeaways for Traders
The price action considered offers more than just profits — it provides learning opportunities for both novice and seasoned traders.
✅ Trend Identification: Early signals of reversals, including rejection wicks and higher-low formations, were cautions for active traders.
✅ Breakout Confirmation: Once crude broke out of consolidation near ₹5,500, momentum buyers shone in glory.
✅ Risk-Reward Payoff: Entries at the very start of the trend brought huge returns with risk under control.
🔑 Remember: Every rally brings the opportunity to make money — or for money to be lost if there is a reversal. In such fast-moving markets, technical stop losses become a must.
Conclusion: Will the Rally Sustain?
Crude oil’s recent bullish trend reminds us that commodities are high-beta assets — capable of both explosive rallies and sharp corrections. Whether you’re a short-term trader or a long-term macro investor, keeping an eye on technical signals, global news, and market sentiment is crucial.
As we move deeper into 2025, watch how inventory reports, geopolitical developments, and central bank policies impact energy prices. For now, the bulls are clearly in control — but always stay prepared for the unexpected in commodity markets.
👉 Join The Safe Trader Academy today and start trading like a pro.