How to Read a Candlestick Chart
Step by Step:
The skill that separates people who guess from people who actually trade.
“ One candlestick tells you what happened between buyers and sellers during that time. When you learn to read candlestick charts, you will see the markets in a completely different way. ”
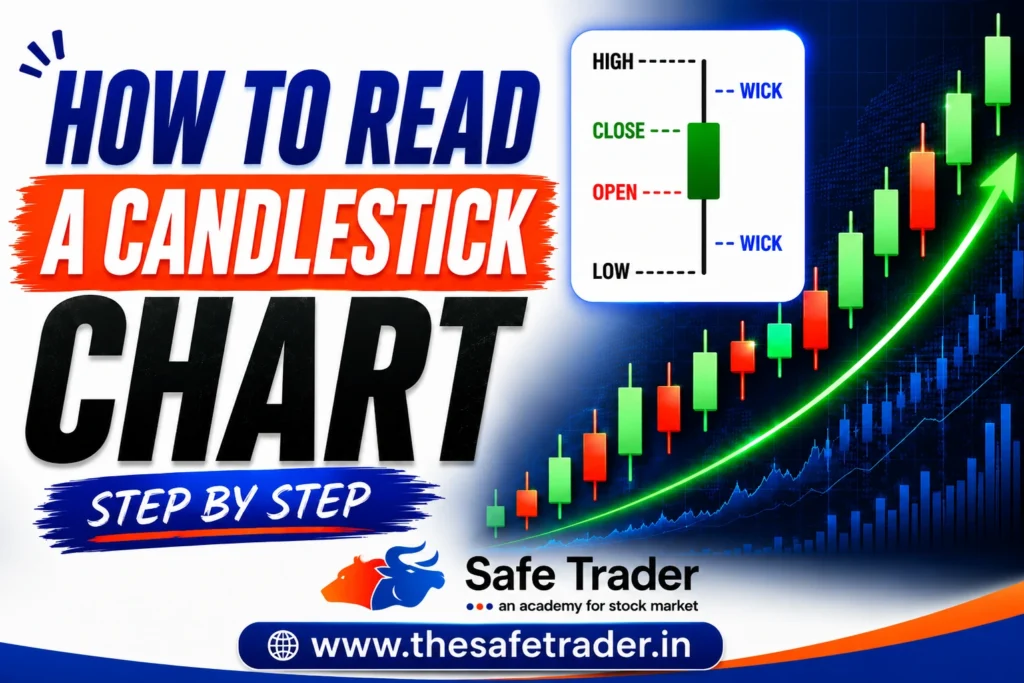
Anatomy of a Candlestick
Body
The distance between the open price and the close price of the candle.
Wick or Shadow
The thin lines above and below the body showing the highest and lowest prices reached.
Green / White Candle
Close price is higher than the open. Buyers won this period.
Red / Black Candle
Close price is lower than the open. Sellers won this period.
Bullish (Green)
Close > Open → Buyers won
Bearish (Red)
Close < Open → Sellers won
The 5 Most Important Candlestick Patterns
Doji
A tiny body with long wicks on both sides.
Signal: Indecision in the market. Price may be about to reverse direction.
Hammer
Small body at top, long wick pointing downward.
Signal: Bullish reversal signal. Buyers pushed price back up from a low.
Shooting Star
Small body at bottom, long upper wick pointing up.
Signal: Strong reversal downward. Sellers overwhelmed buyers completely.
Engulfing Bull
A green candle that fully engulfs the previous red candle.
Signal: Strong reversal upward. Buyers overwhelmed sellers completely.
Engulfing Bear
A red candle that fully engulfs the previous green candle.
Signal: Strong reversal downward. Sellers overwhelmed buyers completely.
How to Read Multiple Candles
One candle gives you a clue. When you look at three candles together, you begin to see the full story. Context is everything.
- Is this pattern at a key support or resistance level?
- Is trading volume spiking on this candle?
- Is the RSI showing oversold or overbought conditions?
- When multiple signals confirm the same direction, your probability of a winning trade increases significantly.
Common Beginner Mistakes with Candles
- Do not trade patterns without first checking the overall trend.
- Do not ignore the timeframe — a hammer on a 1-minute chart is very different from one on a daily chart.
- Always wait for the candle to fully close before entering a trade.
- Do not over-trade every single pattern you spot on the chart.
Key Rule: Always wait for the candle to fully close before you act. A candle is not formed until it closes — so wait for that to happen before making any trading decision.
Candlestick reading is the language of the markets. Start by opening a chart and identifying just two or three patterns. Practice spotting them on historical charts before trading with real money. The more you practice, the better you will get.
Learn the language. Read the chart. Trade with confidence.
About The Safe Trader
The Safe Trader is a stock market training academy in India. They offer classroom and online courses for beginners and traders. You can learn equity, options, commodity and currency trading with live-market training. Their expert mentors teach you how to trade with confidence and discipline. You get help and real-world market experience. The Safe Trader will help you become a confident trader.