TradingView is a powerful platform for traders and investors, offering a wide range of chart types to analyze the markets. Choosing the right chart type is crucial as it affects how you interpret market movements and make trading decisions. In this article, we’ll explore the most popular chart types available on TradingView, their uses, and which chart might be best suited for entry-level traders and professionals.
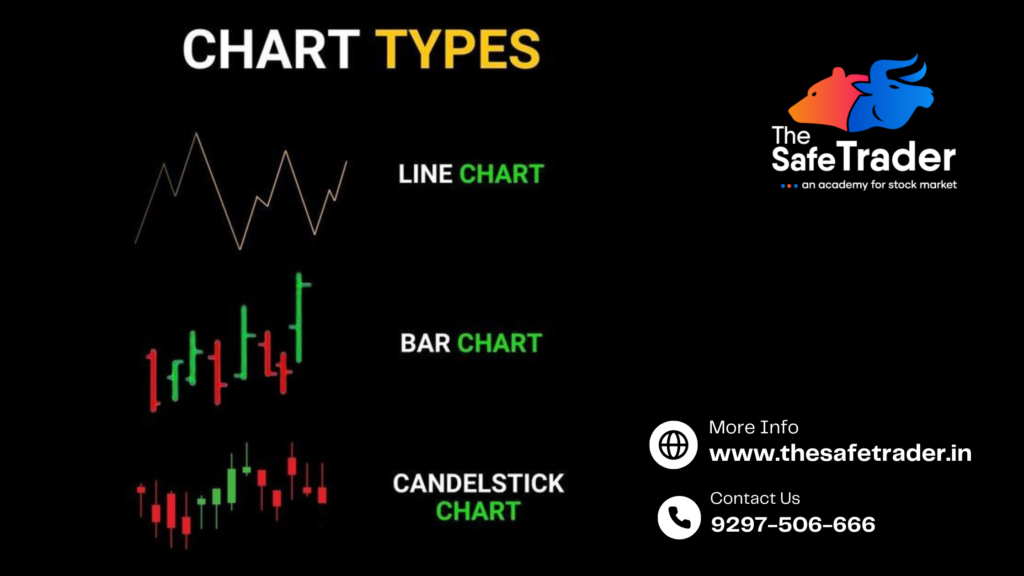
1. Line Chart
Overview:
A Line Chart connects the closing prices of a stock or asset over a specific period, creating a simple line.Best for:
- Entry-Level Traders: Ideal for beginners as it provides a clean, clutter-free view of price trends.
- Analyzing long-term trends.
Pros:
- Simple and easy to understand.
- Highlights the general direction of the market.
Cons:
- Lacks detailed information like open, high, and low prices.
2. Bar Chart
Overview:
A Bar Chart displays price information using vertical bars for each time period, indicating the open, high, low, and close (OHLC) prices.
Best for:
- Intermediate traders who want to understand market volatility.
- Visualizing price ranges and trends.
Pros:
- Detailed representation of price movement.
- Useful for identifying trend reversals.
Cons:
- May appear cluttered to beginners.
3. Candlestick Chart
Overview:
The Candlestick Chart is one of the most widely used chart types. It uses candles to show OHLC prices within a specific period, with the body of the candle representing the price range between the open and close.
Best for:
- All Levels of Traders: Beginners to professionals can benefit from its clear representation of market sentiment.
- Analyzing market trends, patterns, and reversals.
Pros:
- Easy to spot bullish and bearish trends.
- Rich visual representation of price action.
- Patterns like Doji, Hammer, and Engulfing provide actionable insights.
Cons:
- Requires a learning curve to master candlestick patterns.
4. Heikin-Ashi Chart
Overview:
The Heikin-Ashi Chart smoothens price data to create a clearer view of trends, making it easier to identify trend direction without much noise.
Best for:
- Professional traders looking for trend-following strategies.
- Swing and positional traders.
Pros:
- Filters out market noise.
- Helps in identifying trends and reversals clearly.
Cons:
- Does not show exact prices (open, high, low, close).
5. Renko Chart
Overview:
Renko Charts focus on price movement rather than time, with “bricks” appearing when the price moves a certain amount.
Best for:
- Professional traders focused on reducing noise and tracking trends.
- Identifying support and resistance levels.
Pros:
- Eliminates market noise.
- Clear trend signals.
Cons:
- Ignores time, which might be important for certain trading strategies.
6. Point & Figure Chart
Overview:
Point & Figure Charts focus solely on price movement and ignore time and volume. They use “X” and “O” to represent upward and downward movements.
Best for:
- Traders analyzing long-term price trends and breakout points.
Pros:
- Excellent for identifying breakout levels.
- Reduces market noise.
Cons:
- Not ideal for short-term trading.
7. Area Chart
Overview:
Similar to the Line Chart but with a shaded area beneath the line to emphasize the trend.
Best for:
- Entry-level traders who prefer a visual representation of trends.
- Long-term investors.
Pros:
- Simple and visually appealing.
- Highlights trends over time.
Cons:
- Lacks detailed information.
Which Chart Type is Most Useful?
- For Entry-Level Traders:
Line Charts or Area Charts are the simplest to start with as they emphasize trends without overwhelming detail. Once comfortable, beginners can transition to Candlestick Charts for more in-depth analysis. - For Professional Traders:
Heikin-Ashi, Renko, and Point & Figure Charts are preferred for their ability to filter noise and highlight clear trends. Professional traders also use Candlestick Charts extensively for precision trading. - For Intraday Traders:
Candlestick Charts and Heikin-Ashi Charts are popular for intraday trading as they help identify short-term price movements and trends. - For Swing/Positional Traders:
Renko and Heikin-Ashi Charts are effective in identifying longer-term trends and reducing market noise.
Which Chart Type is Most Accurate?
Accuracy depends on your trading strategy. Candlestick Charts are considered reliable for most trading styles due to their detailed price representation. However, Renko and Heikin-Ashi Charts are more accurate for trend-following strategies as they filter out noise.
Which Chart Type Can You Trust?
All chart types are trustworthy if you use them correctly. The choice depends on your trading goals:
- Use Candlestick Charts for detailed analysis and pattern recognition.
- Use Heikin-Ashi Charts or Renko Charts for smooth trend visualization.
- Beginners should start with Line Charts to build confidence.
Conclusion
TradingView offers a variety of chart types to cater to different trading styles and skill levels. Beginners can start with Line or Candlestick Charts, while professionals can explore advanced options like Heikin-Ashi and Renko Charts. Remember, no chart is inherently better than another—it’s about aligning the chart type with your trading strategy and goals.
Happy trading!