If you are interested in Stock Investing, you have probably heard of the P/E Ratio. It is one of the most widely used tools for evaluating whether a stock’s price is fair enough. But what exactly is it? We will break it into simpler terms so that anyone -even a beginner can understand.
What Does P/E Ratio Tell You?
The Price-Earnings Ratio is an indicator that reflects how much the market is willing at present to pay for ₹1 worth of a company’s earnings.
👉 A higher P/E means investors expect higher growth and are willing to pay more for future earnings.
👉 A lower P/E could mean the stock is undervalued — or that the company’s growth prospects aren’t great.
In brief:
➡The P/E ratio depicts a measure of investor confidence and of future expectations about the profitability of a company.
How to Calculate P/E Ratio?
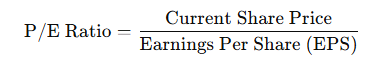
Where:
- Current Share Price is the stock price you see on your trading platform.
- Earnings Per Share (EPS) is calculated by dividing net earnings by the total number of outstanding shares.
Example
Imagine Company A’s share price = ₹300
EPS (last 12 months) = ₹15
✅ This means investors are paying ₹20 for every ₹1 of the company’s earnings.
How Do Investors Use the P/E Ratio?
- Valuation Check – Is it correctly priced concerning its earnings?
- Peer Comparison – How does it fare against competitors or industry averages?
- Growth Signal – Does the market expect a high growth (high P/E) or a low growth (low P/E)?
Example:
Nifty IT Sector companies may have a slightly higher average P/E than Nifty PSU Bank companies because investors expect faster growth from IT companies.
Types of P/E Ratios to Know
| Type | What it Means |
| Trailing P/E | Based on past 12 months’ actual earnings. |
| Forward P/E | Based on forecasted earnings for the next year. |
➡ Trailing P/E tells you what has happened.
➡ Forward P/E tells you what might happen.
P/E Ratio: Points to Remember
- Industry matters: A high P/E in FMCG may be normal, while the same in manufacturing could possibly be considered an overvaluation.
- Growth companies vs mature companies: Start-up or growth companies usually have high P/E ratios since investors expect quick earnings growth.
- Don’t judge a stock only on P/E: A stock could have a low P/E because of business risks, management issues, or slowing demand.
P/E Ratios in Various Scenarios
- Company A (P/E 50): High P/E because the market expects earnings to rise sharply.
- Company B (P/E 8): Low P/E could mean undervalued or it could mean trouble ahead.
Limitations of the P/E Ratio
- Does not consider debt: Suppose two companies with the same P/E have varying financial health; the one with a lot of debt may be at a disadvantage.
- Skewed by abnormal earnings: Rare profits or lots can skew the EPS, and hence P/E.
- Not useful when companies are losing money: If earnings are negative, P/E will either just be negative or become meaningless.
- There is a sector bias: Different sectors naturally have different average P/E levels, so comparison across sectors can be misleading.
How to Effectively Use P/E?
- Compared to peers: Do not look at a company’s P/E in isolation. Look at all the companies that belong in the same industry.
- Combine with other ratios: Look at debt equity, price-to-book, ROE, etc.
- Study the trend: Is the P/E increasing over time, or is it falling? This will indicate how the market perception is changing.
Real-Life Analog: The Indian Stock Market Interface
- Infosys may trade at a higher P/E than Coal India because the IT sector is expected to grow faster and has better profitability.
- PSU stocks may trade at a lower P/E as investors may see them as slower-growth or riskier bets.
Final Thoughts
The P/E ratio is like a quick health check of a stock’s valuation. But remember:
A high P/E doesn’t always mean expensive — it could mean growth.
A low P/E doesn’t always mean cheap — it could mean trouble.
- Always look at the bigger picture: growth prospects, debt, management quality, and industry trends.
👉 Join The Safe Trader Academy today and start trading like a pro.