Technical Analysis Of Stocks Explained
In an era of fast-paced trading and increasing retail investor participation, understanding the fundamentals of technical analysis can provide a distinct edge. Whether you are day trading, swing trading, or investing long-term, reading stock charts and analyzing patterns is essential for identifying market trends and opportunities.
What Is Technical Analysis?
Technical analysis is a method of evaluating securities by analyzing historical price movements and trading volumes. Unlike fundamental analysis, which examines a company’s intrinsic value through financial statements and industry conditions, technical analysis is solely focused on chart data.
It assumes three core principles:
- Market action discounts everything: All known information is reflected in price.
- Prices move in trends: Trends persist until they show signs of reversal.
- History repeats itself: Patterns in price movements tend to recur over time.
The Use of Technical Analysis
The use of technical analysis spans across:
- Identifying entry and exit points
- Determining support and resistance levels
- Recognizing chart patterns
- Assessing market sentiment
It is widely used by traders in stocks, forex, commodities, and cryptocurrencies to make data-driven decisions and reduce emotional trading.
Technical Analysis Chart Patterns
Recognizing technical analysis chart patterns is fundamental to predicting price movements. Here are some commonly used ones:
Reversal Patterns
- Head and Shoulders: Indicates a trend reversal from bullish to bearish (and vice versa).
- Double Top/Bottom: Suggests a reversal after testing resistance or support twice.
Continuation Patterns
- Triangles (Ascending, Descending, Symmetrical): Show price consolidation before a breakout.
- Flags and Pennants: Short-term patterns indicating a brief pause before the prevailing trend continues.
Technical Analysis of Stocks
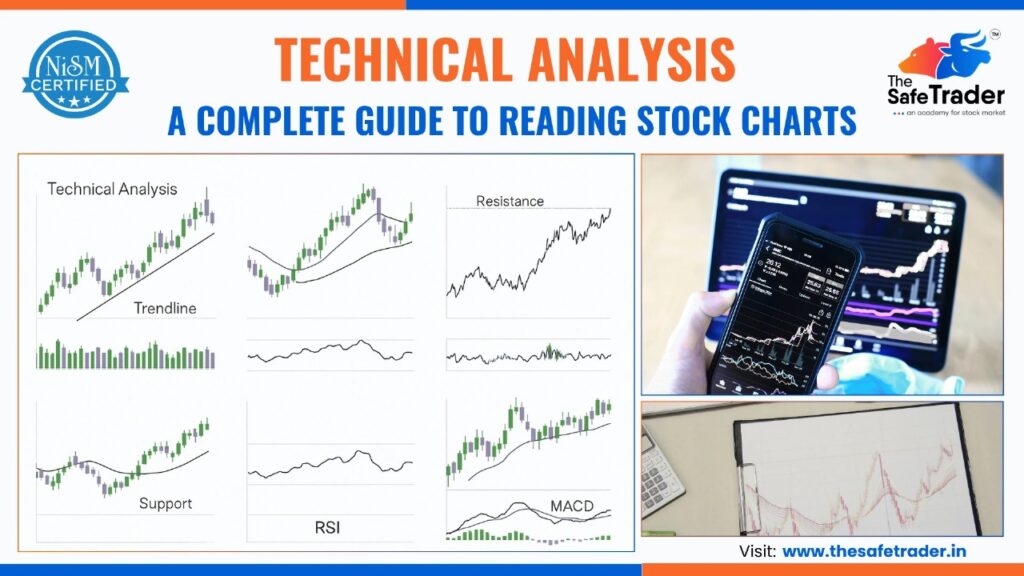
Applying technical analysis of stocks involves reviewing:
- Historical price data
- Short- and long-term moving averages
- Volume surges at support/resistance
- Price momentum indicators like RSI or MACD
By using a combination of these elements, investors can develop a systematic approach to stock selection, timing, and risk management.
Final Thoughts
Mastering technical analysis is an ongoing journey that begins with learning how to read charts and recognize key patterns. For new investors, starting with a few indicators and patterns can simplify the learning curve. As experience grows, so will your ability to identify setups and make confident decisions.
Stay disciplined, always use risk management, and remember: charts tell a story – learn to read it well.
For the latest market updates and insights, follow The Safe Trader Academy.