
Celebrate Dussehra with a 15% OFF on Stock Market Courses at The Safe Trader Academy!

This Dussehra celebrate a step forward in financial knowledge and more intelligent investing! Those of you who have been thinking about learning how to trade on the stock market or who wish to improve your investment skills can now take advantage of a special festive offer from The Safe Trader Academy – a flat 15% discount on all their courses, provided that the applicable terms and conditions are met. Dussehra stands as a symbol of new beginnings, representing the victory of good over evil and the courage needed to welcome positive change. Is there a more appropriate way to mark this festive season than by investing in your knowledge, gaining an understanding of financial markets, and developing a disciplined method for trading and investing? If you’re new and have just started to look into the stock market or if you’re an aspiring trader who wants to improve your skills, start your learning journey today. What makes the Dussehra Stock Market Courses offering special? Ensure that this festive season is a worthwhile one by getting some stock market education from The Safe Trader Academy! Look into training programs which are designed to familiarise learners with important concepts in financial markets, trading strategies, investment principles, and risk management. Enjoy a flat 15% discount on all courses! Our Stock Market Courses:✅ Professional Trader Program (Beginner to Advanced = All-in-One Combo)✅ Technical Analysis Course✅ Futures & Options (F&O) Trading Course✅ Forex & Commodity Trading Course✅ Smart Money Concepts (SMC) & ICT Trading✅ Equity Investment Course Whether your goal is to understand market movements, analyze stock charts, or learn the fundamentals of investing, choosing the right course can help you build a stronger foundation. Why Consider The Safe Trader Academy? Choosing a stock market training institute is an important step in your learning journey. The Safe Trader Academy advertises several learning features intended to support students. ✔️ ISO-Certified Training Institute in Hyderabad, India✔️ NISM-Certified Mentors✔️ Practical Learning & Live Market Analysis✔️ Personal 1-to-1 Guidance✔️ Lifetime Learning Support Why Learn Stock Market Trading? Stock market education can help you to make more informed financial decisions. The following are five areas that is important to concentrate on: 1. Understand market fundamentals Find out how stock exchanges, shares, indices, and financial instruments function. 2. Work on your ability to read charts Look at candlesticks, trends, areas of support and resistance, and technical indicators. 3. Understand risk management Find out about position sizing, stop-loss orders, leverage, and risk-reward ratios. 4. Develop trading discipline It is important to understand the value of patience, careful planning, being consistent, and avoiding decisions that are based on emotion. 5. Enhance your knowledge of investments Look at the company’s fundamentals, evaluate the stock, consider your portfolio, and study the principles of long-term investing. Keep in mind that while education can enhance your understanding of financial markets it cannot get rid of risk or ensure that you make a profit from trading. Make This Dussehra a New Beginning! A new skill can be a valuable investment in yourself. This Dussehra, explore the world of financial markets, strengthen your understanding of trading and investing, and take a more informed approach to your financial education. 📩 For course details, visit website or contact The Safe Trader Academy. We’re happy to help!📞 WhatsApp / Call: +91 92975 06666🌐 Website: www.thesafetrader.in 📌 Disclaimer:This course is provided for educational purposes only.
Technical Analysis: How to Read Market Data Like a Pro

Introduction Every day the stock market produces vast quantities of information such as price changes, trading volume, charts, and market trends. Yet possessing market data alone is not sufficient for making informed decisions about trading. It is actually necessary to understand and interpret that information. A Technical Analysis Course enables traders to examine past price movements, spot trends, and assess possible trading opportunities by using charts and technical indicators. It’s useful whether one is a novice or a seasoned trader since learning how to interpret market data can help them establish a more structured method of trading. The Safe Trader Academy assists people in coming to understand trading platforms, technical tools, chart patterns, and the principles of risk management. What Is Technical Analysis? Technical Analysis is a method which involves assessing financial markets by examining price charts, trading volume, and the market’s historical behaviour. It enables traders to spot patterns and evaluate possible price movements. Technical analysis mainly looks at price movement and market activity, whereas fundamental analysis concentrates on a company’s financial statements, its business performance, and economic conditions. Its key principles include: Technical analysis won’t ensure accurate forecasts; it instead offers a framework for assessing opportunities and making decisions on the basis of observable market information. What is the importance of trading platforms and tools? Trading platforms offer access to market prices, charts, indicators, and the facilities needed to execute orders. Proper trading tools can help traders to monitor securities and analyse changes in the market efficiently. Important features include: Live Market Data: You can monitor price changes and market activity throughout the trading hours. Advanced Charts: In the Advanced Charts section, you can study price movements over various time frames. Technical Indicators: Use technical indicators such as moving averages, RSI, and MACD when assessing trends and momentum. Drawing Tools: You can use the drawing tools to plot trend lines, identify support levels, mark resistance areas, and indicate potential breakout zones. Stock Screeners: Use stock screeners to select shares based on the criteria you have chosen and spot those securities which are worth further investigation. It is essential to understand how these tools function if one is to develop an organised trading process. How to Read Stock Market Charts Charts show price information in a visual format, which assists traders in understanding past price movements and in spotting possible patterns. 1. Line Charts Line charts show how closing prices were connected over a given period and give a simple summary of the direction of the market, helping to identify general trends.2. Bar Charts Bar charts show the opening, closing, highest, and lowest prices for a given period and contain more detailed information regarding price movements. 3. Candlestick Charts Candlestick charts present the opening, closing, highest, and lowest prices in a visual manner, and bullish and bearish candles aid traders in understanding the pressure from buyers and sellers. Individual candlestick patterns should instead be understood in conjunction with market structure and other pertinent information rather than being regarded as certain trading signals. Understanding Trends, Support, and Resistance Finding out which way the market is heading is an essential element of technical analysis. An uptrend is usually characterised by higher highs and higher lows, whereas a downtrend is one with lower highs and lower lows. If prices are moving within a fairly stable range, the market might be in a consolidation phase. Support is a price level at which buying interest could develop and thus may serve to slow a decline, while resistance is a price level at which selling pressure might show up and as a result may act to slow an advance. Traders apply these levels when assessing possible entries, exits, breakouts, and reversals. While trend lines and price action can offer further context, support and resistance are not guaranteed to be barriers. Understanding Volume Analysis and Indicators Volume analysis enables traders to get an understanding of the degree of participation associated with price movements. For instance, a breakout that occurs together with higher-than-normal volume suggests a greater level of market participation than one that takes place on low volume. Technical indicators offer extra information regarding how prices behave. Moving Averages can be used to determine the direction of a trend. The Relative Strength Index (RSI) is a measure of momentum and can help in identifying situations where a security may be overbought or oversold. The MACD is generally used to look at the relationship between trend and momentum. There is no indicator that functions perfectly under all market conditions. Traders must know the limitations of each tool and should not base their decisions on a single signal. A more thorough market analysis can be achieved by combining price action, volume, and certain indicators. Why Risk Management Matters A loss may still occur even if a trade is carefully analysed. It is therefore essential for each trader to have risk management. Before you enter a trade you should decide on the entry price, the stop-loss level, the target and the size of the position. You must take into account the potential reward in relation to the amount you are at risk of losing and avoid risking money which you cannot afford to lose. A trading journal can be of use in recording your decisions, in assessing the results, and in spotting mistakes; furthermore, it can also assist new traders in understanding how a strategy works before they start using real capital. It should be remembered that stop-loss orders do not ensure that they will be executed at the precise price you have chosen during periods of volatility or when there are price gaps. Learn Technical Analysis with The Safe Trader Academy To fully understand market data, it is necessary not only to watch prices change but also to learn how to read charts, identify trends, interpret volume, use technical tools, and systematically manage risk. The Safe Trader Academy provides learning opportunities for those who wish to improve their knowledge of the stock market and gain a better
SMC & ICT Trading Program: Learn Smart Money Concepts, Market Structure & Price Action
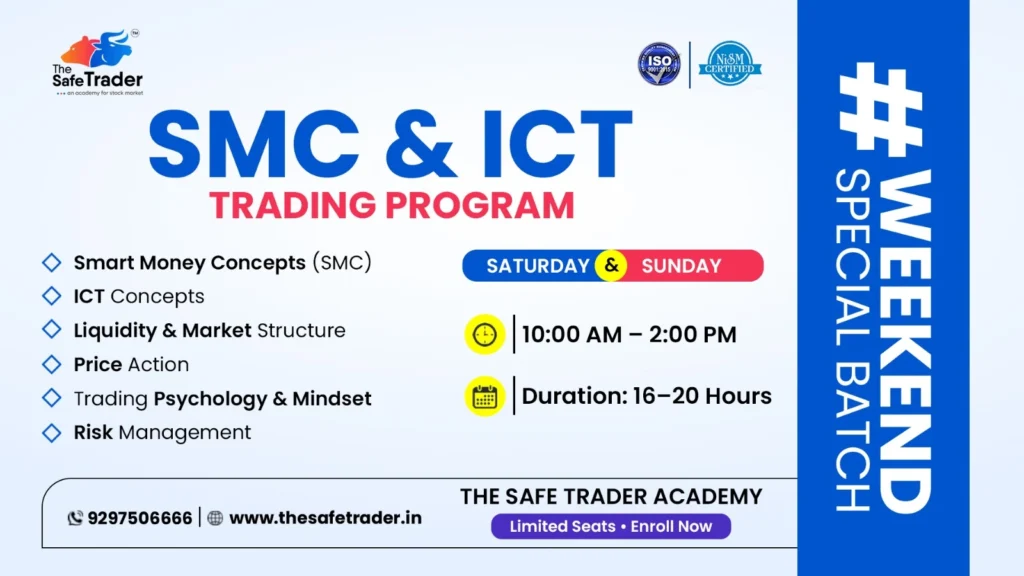
SMC & ICT Trading Program: A Structured Approach to Modern Trading The financial markets are always changing and traders are now going beyond the use of traditional indicators if they are to understand price action, market structure and liquidity. Among traders two approaches have attracted a great deal of attention namely Smart Money Concepts (SMC) and ICT concepts. The structured learning method offered by The Safe Trader Academy’s SMC & ICT Trading Program is intended to enable traders to come to understand these concepts. Attention is given to key areas including Smart Money Concepts, ICT Concepts, Liquidity and Market Structure, Price Action, Trading Psychology and Mindset, and Risk Management. Beginners as well as those who are already involved in trading can benefit from learning how to analyse market behaviour since it will enable them to adopt a more disciplined and systematic method of trading. What counts as a smart money concept? Smart Money Concepts (SMC) is a method of trading which involves studying the way in which price behaves near significant market structures and liquidity zones. Instead of relying completely on technical indicators, SMC analysis advises traders to look at price movements and market behaviour. They can then examine market structure, liquidity, price action and possible areas where substantial buying or selling might take place. The Smart Money Concepts course enables traders to learn concepts which will help them to interpret charts in a more structured manner; its aim is not to predict every movement in the market but rather to establish a procedure for spotting possible trading opportunities while at the same time managing risk appropriately. Understanding ICT Concepts ICT, which is usually linked with the Inner Circle Trader method, is another approach that places a strong emphasis on market structure, liquidity and price delivery. A course in ICT trading can help learners to understand how price may interact with liquidity and with important levels in the market; rather than focusing on a single candlestick or indicator, traders can learn to take into account the wider market context. The integration of SMC and ICT ideas can give traders further tools for the analysis of market behaviour. Yet traders must bear in mind that no trading method can ensure a profit and that all strategies involve risk. Liquidity & Market Structure A key aspect of an SMC & ICT Trading Program is having a good understanding of liquidity and market structure. Market structure enables traders to determine the general way in which prices behave. It gives them clues as to whether the market is moving upwards, downwards or possibly changing direction from one to the other. Liquidity is also a significant concept; in simple terms it means areas in which large orders may be found. The price will move towards such areas of liquidity before either continuing its movement or changing direction. Learning to identify these relationships can enable traders to gain a better understanding of why the price might react at certain levels. The Importance of Price Action Price action trading consists of directly studying price movements rather than depending only on indicators. Candlestick patterns, along with market swings, highs and lows, breakouts, reversals and other price movements, can give valuable information regarding market conditions. For traders who are studying SMC and ICT strategies, price action is of particular importance since a great many of the concepts are based on the way in which price behaves near certain market structures and liquidity zones. A disciplined use of price action can assist traders in moving away from making random entries and in ensuring that they have a clear reason for each trade. Trading Psychology & Mindset Technical knowledge is only one element in the process of becoming a better trader, and trading psychology can have a significant effect on the decisions made. Even if traders understand their strategy, emotions like fear, greed, impatience and overconfidence can still influence their decisions. There are cases in which traders will enter a trade without confirmation, move their stop-loss level unreasonably, or keep on trading after having suffered a number of losses. To develop the correct trading mindset it is necessary to learn how to stick to a trading plan and to stay disciplined. Important psychological habits include: A firm mental attitude can go hand in hand with technical knowledge and risk-management practices. Why Risk Management Is Essential However confident a trader may be about the effectiveness of a strategy, losses will always be a part of financial markets and thus risk management in trading becomes one of the most important skills to develop. A proper risk-management approach may include understanding: For instance, if a trader risks too much of their capital on one trade then it can have a significant effect on their entire account when that trade goes against them. A successful strategy for trading SMC or for trading ICT should always be accompanied by suitable risk-management principles. What does the SMC and ICT trading programme include? The SMC & ICT Trading Program at The Safe Trader Academy covers several important areas of modern trading education, including: Learn the fundamental principles of SMC and find out how market behaviour can be analysed using price and structure. Look at the key ICT-related concepts concerning liquidity, market structure and price movement. Find out how market structure and liquidity can be used in technical analysis. Understand how prices move and what chart behaviour looks like. Take care to learn what discipline, patience and emotional control mean. Learn how to manage trading risk and develop a systematic method for protecting your capital. Who is capable of learning SMC & ICT trading? An SMC trading course is useful for a variety of learners, such as those who are beginning their careers in trading and traders who currently engage in trading and wish to broaden their knowledge. The program may be suitable for: However, acquiring a strategy is only the first step; traders also need practice, an analysis of charts, discipline, and ongoing learning if they are
How to Build a Long-Term Stock Portfolio for Wealth Creation

Stock Market Collaboration : Partner with The Safe Trader In India the sector offering financial education is expanding and there is a great need for people to gain useful, practical and accessible knowledge about the stock market. At The Safe Trader Academy we think that collaboration is one of the best methods of getting people in touch with appropriate educational materials. We want to establish meaningful collaborations with finance websites, bloggers, YouTubers, influencers, trading communities, podcasts, media platforms, and financial education companies in India. Our objective is straightforward-to cooperate, get our message across to the right audience, and make high-quality stock market education more accessible. Why Stock Market Collaboration Matters Nowadays people get information about the stock market from a wide variety of sources. A few of them read finance blogs, while others opt for YouTube videos, podcasts, social media, webinars, or trading communities. It provides an opportunity for educators, creators, and financial platforms to collaborate. A good collaboration can combine different strengths since one partner might have an established audience and the other might offer structured educational material and practical learning opportunities. We at The Safe Trader Academy are looking for partnerships that are useful, transparent, and valuable to both parties. Stock Market Collaboration Opportunities We will consider various kinds of partnerships based on the interests and audience of the partner in question. Affiliate & Referral Partnerships People who are involved in finance-such as website operators, content creators, and members of online communities-can look into affiliate and referral opportunities through The Safe Trader Academy. Finance Blog & Website Collaborations We can deal with finance websites and bloggers by means of educational articles, sponsored content, guest posts, and topics that are relevant to the stock market. YouTube & Social Media Collaborations We can work with creators via educational videos, interviews, content that helps with market understanding, webinars, and social media campaigns. Podcasts & Interviews Podcasts and media platforms can get in touch with us to discuss matters relating to stock market education, trading ideas, financial learning, and similar subjects. Webinars & Trading Workshops We have the opportunity to take part in webinars and workshops that are jointly organised to give audiences access to organised learning on topics relating to the stock market and trading. Guest Articles & Educational Content Finance publishers and the trading communities can work together on producing informative material relating to market education, the basics of trading, analysis, and practical learning. With whom can The Safe Trader Academy partner? We are willing to work together with people, companies, and platforms who have an audience interested in the stock markets and financial education. Potential partners include: Finance Websites & Bloggers YouTubers & Content Creators Stock Market Influencers Trading Communities Podcasts & Media Platforms Financial Education Platforms Business & Finance Media Online Communities We will be happy to talk about possible collaboration ideas whether you are an experienced finance content producer or not. About The Safe Trader Academy The Safe Trader Academy is a stock market training institute which is based in Hyderabad, India. We are focusing on helping learners to gain a better understanding of the stock market by providing them with structured education and practical learning. Instead of sticking solely to theory, our training also makes use of examples related to the market, assigns tasks, involves students in analysis, and provides them with practical experience so that they can understand how various concepts function. What will you be able to learn at The Safe Trader Academy? Our educational programs cover a wide range of stock market and trading topics, including: Indian Share Market Basics Equity Investment Fundamental Analysis Technical Analysis Futures & Options Forex Trading Commodity Trading Intraday Trading Strategies Trading Tools & Software Live Market Analysis Practical Market Assignments Training can be obtained either through online or offline classes, according to the specific program and the learner’s requirements. Practical Learning for Stock Market Students To understand the stock market it is not enough just to read about charts, indicators, or trading terminology. Students can benefit from practical learning in terms of understanding how market concepts are applied in real-life situations. As part of the learning process at The Safe Trader, students have the opportunity to gain exposure to live market analysis, receive real-time market assignments, and also get structured guidance. The academy also gives learners the chance to interact with trainers and get guidance as they go on their learning journey. Building a Financial Education Community A successful collaboration in the stock market is not just about promotion; it is about establishing useful links between educators, creators, communities, and those who wish to learn. The Safe Trader Academy intends to help create a broader financial education ecosystem by collaborating with finance platforms and content creators so that learners can access suitable and well-organized educational materials. We think that long-term partnerships are the result of trust, useful content, consistent communication, and mutual benefit. What’s the reason for partnering with The Safe Trader Academy? A collaboration with The Safe Trader can provide opportunities to: Create educational stock market content Reach audiences interested in trading and investing Conduct webinars and workshops Develop finance-focused campaigns Explore affiliate and referral partnerships Share educational resources Build long-term professional relationships Since every partnership is going to be different, we are willing to look at ideas taking into account the partner’s audience, platform, and objectives. Let’s Collaborate We should be pleased to look into the possibility of working together if you are a finance blogger, YouTuber, influencer, trading community, podcast host, or a financial education business. Let’s collaborate in order to produce useful financial education material and get more people access to structured stock market learning. 📞 WhatsApp / Call: +91 92975 06666🌐 Website: www.thesafetrader.in
Stock Market Collaboration : Partner with The Safe Trader Academy

Stock Market Collaboration : Partner with The Safe Trader In India the sector offering financial education is expanding and there is a great need for people to gain useful, practical and accessible knowledge about the stock market. At The Safe Trader Academy we think that collaboration is one of the best methods of getting people in touch with appropriate educational materials. We want to establish meaningful collaborations with finance websites, bloggers, YouTubers, influencers, trading communities, podcasts, media platforms, and financial education companies in India. Our objective is straightforward-to cooperate, get our message across to the right audience, and make high-quality stock market education more accessible. Why Stock Market Collaboration Matters Nowadays people get information about the stock market from a wide variety of sources. A few of them read finance blogs, while others opt for YouTube videos, podcasts, social media, webinars, or trading communities. It provides an opportunity for educators, creators, and financial platforms to collaborate. A good collaboration can combine different strengths since one partner might have an established audience and the other might offer structured educational material and practical learning opportunities. We at The Safe Trader Academy are looking for partnerships that are useful, transparent, and valuable to both parties. Stock Market Collaboration Opportunities We will consider various kinds of partnerships based on the interests and audience of the partner in question. Affiliate & Referral Partnerships People who are involved in finance-such as website operators, content creators, and members of online communities-can look into affiliate and referral opportunities through The Safe Trader Academy. Finance Blog & Website Collaborations We can deal with finance websites and bloggers by means of educational articles, sponsored content, guest posts, and topics that are relevant to the stock market. YouTube & Social Media Collaborations We can work with creators via educational videos, interviews, content that helps with market understanding, webinars, and social media campaigns. Podcasts & Interviews Podcasts and media platforms can get in touch with us to discuss matters relating to stock market education, trading ideas, financial learning, and similar subjects. Webinars & Trading Workshops We have the opportunity to take part in webinars and workshops that are jointly organised to give audiences access to organised learning on topics relating to the stock market and trading. Guest Articles & Educational Content Finance publishers and the trading communities can work together on producing informative material relating to market education, the basics of trading, analysis, and practical learning. With whom can The Safe Trader Academy partner? We are willing to work together with people, companies, and platforms who have an audience interested in the stock markets and financial education. Potential partners include: Finance Websites & Bloggers YouTubers & Content Creators Stock Market Influencers Trading Communities Podcasts & Media Platforms Financial Education Platforms Business & Finance Media Online Communities We will be happy to talk about possible collaboration ideas whether you are an experienced finance content producer or not. About The Safe Trader Academy The Safe Trader Academy is a stock market training institute which is based in Hyderabad, India. We are focusing on helping learners to gain a better understanding of the stock market by providing them with structured education and practical learning. Instead of sticking solely to theory, our training also makes use of examples related to the market, assigns tasks, involves students in analysis, and provides them with practical experience so that they can understand how various concepts function. What will you be able to learn at The Safe Trader Academy? Our educational programs cover a wide range of stock market and trading topics, including: Indian Share Market Basics Equity Investment Fundamental Analysis Technical Analysis Futures & Options Forex Trading Commodity Trading Intraday Trading Strategies Trading Tools & Software Live Market Analysis Practical Market Assignments Training can be obtained either through online or offline classes, according to the specific program and the learner’s requirements. Practical Learning for Stock Market Students To understand the stock market it is not enough just to read about charts, indicators, or trading terminology. Students can benefit from practical learning in terms of understanding how market concepts are applied in real-life situations. As part of the learning process at The Safe Trader, students have the opportunity to gain exposure to live market analysis, receive real-time market assignments, and also get structured guidance. The academy also gives learners the chance to interact with trainers and get guidance as they go on their learning journey. Building a Financial Education Community A successful collaboration in the stock market is not just about promotion; it is about establishing useful links between educators, creators, communities, and those who wish to learn. The Safe Trader Academy intends to help create a broader financial education ecosystem by collaborating with finance platforms and content creators so that learners can access suitable and well-organized educational materials. We think that long-term partnerships are the result of trust, useful content, consistent communication, and mutual benefit. What’s the reason for partnering with The Safe Trader Academy? A collaboration with The Safe Trader can provide opportunities to: Create educational stock market content Reach audiences interested in trading and investing Conduct webinars and workshops Develop finance-focused campaigns Explore affiliate and referral partnerships Share educational resources Build long-term professional relationships Since every partnership is going to be different, we are willing to look at ideas taking into account the partner’s audience, platform, and objectives. Let’s Collaborate We should be pleased to look into the possibility of working together if you are a finance blogger, YouTuber, influencer, trading community, podcast host, or a financial education business. Let’s collaborate in order to produce useful financial education material and get more people access to structured stock market learning. 📞 WhatsApp / Call: +91 92975 06666🌐 Website: www.thesafetrader.in
WE’RE HIRING – Stock Market Trainer & Trader Jobs in Hyderabad

Trading in Futures: A Complete Beginner’s Guide To FuturesTrading A Beginner’s Guide to Smarter Market Analysis Trading the stock market is never as simple as looking at a stock and pressing Buy or Sell. Before initiating a trade, traders need to analyze charts, study the stock, look for opportunities, manage their trades, and track their performance. The process can be overwhelming, especially when the market moves fast. This is where trading tools and software come in handy. The best trading tools and software can help traders organize their data, analyze the market, and trade in a more structured manner. But it is important to remember that no software can guarantee profits. Trading Tools & Software Trading tools and software are applications or platforms that help traders analyze the market and manage their trades. Depending on the tool, traders can get access to: Real-time or delayed market data Interactive charts Stock scanners Watchlists Order management Portfolio tracking Strategy testing Risk-management tools Instead of using multiple resources to get market data, you can combine all of them in one platform using the right tools and software. Why Are Trading Tools Important? Imagine having to analyze hundreds of stocks manually every single day. It would take a lot of time and effort, right? This is where a stock scanner can be useful. Instead of manually looking for stocks that meet your criteria, you can scan for them and narrow down your shortlist. Similarly, you can use charting tools to find stocks with the best patterns, trends, and other factors. The idea is to make the process of trading easier and more organized. Let’s take a look at some of the most popular trading tools and software. 1. Technical Charting Tools Charts are one of the most important tools for traders. Using charts, you can analyze the price movement of a stock and make better trading decisions. Depending on the charting platform, you can use candlestick, line, bar, trendlines, support/resistance, moving averages, RSI, MACD, volume, and other indicators to analyze the market. For instance, you can use a candlestick chart with moving averages to identify the trend of the stock. 2. Stock Screeners & Scanners When you are looking to buy a stock, you might have a set of criteria in mind. But how do you narrow down your search from thousands of stocks? This is where stock screeners and scanners can be useful. Using a stock scanner, you can set your criteria and let the software do the hard work for you. You can scan for stocks based on price, volume, market cap, price change, technical indicators, breakout stocks, and more. Instead of manually searching for stocks, you can use scanners to find the best opportunities. 3. Real-Time Market Data Markets are highly volatile, and prices change rapidly. With real-time market data, you can keep track of the latest news and price movements. You can also track your open positions, volume, market data, and other relevant data. Real-time market data is important, but it is important to remember that it is only a tool. 4. Strategy Testing Tools Have you ever wondered how a trading strategy would have performed in the past? Some platforms offer strategy testing tools that allow you to backtest your strategies. Using a strategy tester, you can test how a strategy would have performed using historical data. For instance, you can test a simple strategy where you buy a stock when it breaks out above a certain level, set a stop loss below a certain level, and sell when it reaches a specific target. Testing a strategy can help you identify whether it is profitable or not, but it is important to remember that past performance is not an indicator of future performance. 5. Portfolio & Trade Tracking Tools Trading is not just about buying and selling stocks. It is also about keeping track of your trades and analyzing your performance. Keeping a portfolio tracker and a trading journal can help you track your trades, analyze your performance, and improve as a trader. You can record your trade entry and exit prices, profit and loss, stop loss levels, position sizing, strategy, mistakes, and much more. Keeping track of your trades can help you identify what works and what doesn’t. For instance, you may realize that you are closing winning trades too early or holding on to losing trades for too long. You can then work on improving your trading behavior. How to Choose the Best Trading Software? Many beginner traders make the mistake of downloading too many trading tools and software. The more tools you have, the more complicated it can get. Instead, focus on having a few quality tools that can help you trade better. A good trading platform, a reliable charting software, a stock scanner, and risk-management tools can go a long way in your trading journey. As you grow as a trader, you can then add more tools to your arsenal. The best trading software is the one that helps you trade better. Final Thoughts Trading tools and software can make your trading process easier and more organized. From technical charting tools to stock scanners, real-time market data, strategy testers, and portfolio trackers, there are many tools that can help you trade smarter. But remember, a tool is only as good as the person using it. A scanner cannot replace market knowledge, and no indicator can predict market movement with 100% accuracy. At The Safe Trader Academy, learning to use market tools and technical analysis is just the beginning. With our trading courses, you will also learn how to develop profitable trading strategies and manage your risk better. Trade smarter with The Safe Trader Academy. Learn to analyze the market, trade better, and manage your risk. Disclaimer: Trading and investing involve market risks. The information provided above is for educational purposes only and should not be considered investment advice or a guarantee of returns. 📞 WhatsApp / Call: +91 92975 06666🌐 Website: www.thesafetrader.in
Trading in Futures: A Complete Beginner’s Guide To Futures Trading

Trading in Futures: A Complete Beginner’s Guide To FuturesTrading A Beginner’s Guide to Smarter Market Analysis Trading the stock market is never as simple as looking at a stock and pressing Buy or Sell. Before initiating a trade, traders need to analyze charts, study the stock, look for opportunities, manage their trades, and track their performance. The process can be overwhelming, especially when the market moves fast. This is where trading tools and software come in handy. The best trading tools and software can help traders organize their data, analyze the market, and trade in a more structured manner. But it is important to remember that no software can guarantee profits. Trading Tools & Software Trading tools and software are applications or platforms that help traders analyze the market and manage their trades. Depending on the tool, traders can get access to: Real-time or delayed market data Interactive charts Stock scanners Watchlists Order management Portfolio tracking Strategy testing Risk-management tools Instead of using multiple resources to get market data, you can combine all of them in one platform using the right tools and software. Why Are Trading Tools Important? Imagine having to analyze hundreds of stocks manually every single day. It would take a lot of time and effort, right? This is where a stock scanner can be useful. Instead of manually looking for stocks that meet your criteria, you can scan for them and narrow down your shortlist. Similarly, you can use charting tools to find stocks with the best patterns, trends, and other factors. The idea is to make the process of trading easier and more organized. Let’s take a look at some of the most popular trading tools and software. 1. Technical Charting Tools Charts are one of the most important tools for traders. Using charts, you can analyze the price movement of a stock and make better trading decisions. Depending on the charting platform, you can use candlestick, line, bar, trendlines, support/resistance, moving averages, RSI, MACD, volume, and other indicators to analyze the market. For instance, you can use a candlestick chart with moving averages to identify the trend of the stock. 2. Stock Screeners & Scanners When you are looking to buy a stock, you might have a set of criteria in mind. But how do you narrow down your search from thousands of stocks? This is where stock screeners and scanners can be useful. Using a stock scanner, you can set your criteria and let the software do the hard work for you. You can scan for stocks based on price, volume, market cap, price change, technical indicators, breakout stocks, and more. Instead of manually searching for stocks, you can use scanners to find the best opportunities. 3. Real-Time Market Data Markets are highly volatile, and prices change rapidly. With real-time market data, you can keep track of the latest news and price movements. You can also track your open positions, volume, market data, and other relevant data. Real-time market data is important, but it is important to remember that it is only a tool. 4. Strategy Testing Tools Have you ever wondered how a trading strategy would have performed in the past? Some platforms offer strategy testing tools that allow you to backtest your strategies. Using a strategy tester, you can test how a strategy would have performed using historical data. For instance, you can test a simple strategy where you buy a stock when it breaks out above a certain level, set a stop loss below a certain level, and sell when it reaches a specific target. Testing a strategy can help you identify whether it is profitable or not, but it is important to remember that past performance is not an indicator of future performance. 5. Portfolio & Trade Tracking Tools Trading is not just about buying and selling stocks. It is also about keeping track of your trades and analyzing your performance. Keeping a portfolio tracker and a trading journal can help you track your trades, analyze your performance, and improve as a trader. You can record your trade entry and exit prices, profit and loss, stop loss levels, position sizing, strategy, mistakes, and much more. Keeping track of your trades can help you identify what works and what doesn’t. For instance, you may realize that you are closing winning trades too early or holding on to losing trades for too long. You can then work on improving your trading behavior. How to Choose the Best Trading Software? Many beginner traders make the mistake of downloading too many trading tools and software. The more tools you have, the more complicated it can get. Instead, focus on having a few quality tools that can help you trade better. A good trading platform, a reliable charting software, a stock scanner, and risk-management tools can go a long way in your trading journey. As you grow as a trader, you can then add more tools to your arsenal. The best trading software is the one that helps you trade better. Final Thoughts Trading tools and software can make your trading process easier and more organized. From technical charting tools to stock scanners, real-time market data, strategy testers, and portfolio trackers, there are many tools that can help you trade smarter. But remember, a tool is only as good as the person using it. A scanner cannot replace market knowledge, and no indicator can predict market movement with 100% accuracy. At The Safe Trader Academy, learning to use market tools and technical analysis is just the beginning. With our trading courses, you will also learn how to develop profitable trading strategies and manage your risk better. Trade smarter with The Safe Trader Academy. Learn to analyze the market, trade better, and manage your risk. Disclaimer: Trading and investing involve market risks. The information provided above is for educational purposes only and should not be considered investment advice or a guarantee of returns. 📞 WhatsApp / Call: +91 92975 06666🌐 Website: www.thesafetrader.in
Trading Tools & Software: Beginner’s Guide
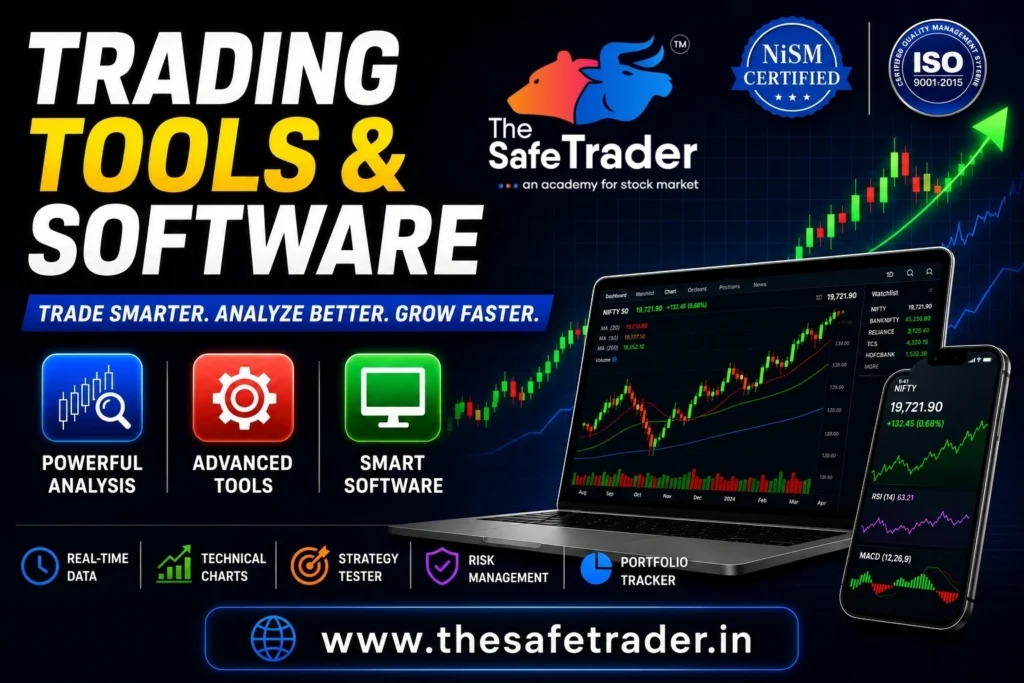
A Beginner’s Guide to Smarter Market Analysis Trading the stock market is never as simple as looking at a stock and pressing Buy or Sell. Before initiating a trade, traders need to analyze charts, study the stock, look for opportunities, manage their trades, and track their performance. The process can be overwhelming, especially when the market moves fast. This is where trading tools and software come in handy. The best trading tools and software can help traders organize their data, analyze the market, and trade in a more structured manner. But it is important to remember that no software can guarantee profits. Trading Tools & Software Trading tools and software are applications or platforms that help traders analyze the market and manage their trades. Depending on the tool, traders can get access to: Real-time or delayed market data Interactive charts Stock scanners Watchlists Order management Portfolio tracking Strategy testing Risk-management tools Instead of using multiple resources to get market data, you can combine all of them in one platform using the right tools and software. Why Are Trading Tools Important? Imagine having to analyze hundreds of stocks manually every single day. It would take a lot of time and effort, right? This is where a stock scanner can be useful. Instead of manually looking for stocks that meet your criteria, you can scan for them and narrow down your shortlist. Similarly, you can use charting tools to find stocks with the best patterns, trends, and other factors. The idea is to make the process of trading easier and more organized. Let’s take a look at some of the most popular trading tools and software. 1. Technical Charting Tools Charts are one of the most important tools for traders. Using charts, you can analyze the price movement of a stock and make better trading decisions. Depending on the charting platform, you can use candlestick, line, bar, trendlines, support/resistance, moving averages, RSI, MACD, volume, and other indicators to analyze the market. For instance, you can use a candlestick chart with moving averages to identify the trend of the stock. 2. Stock Screeners & Scanners When you are looking to buy a stock, you might have a set of criteria in mind. But how do you narrow down your search from thousands of stocks? This is where stock screeners and scanners can be useful. Using a stock scanner, you can set your criteria and let the software do the hard work for you. You can scan for stocks based on price, volume, market cap, price change, technical indicators, breakout stocks, and more. Instead of manually searching for stocks, you can use scanners to find the best opportunities. 3. Real-Time Market Data Markets are highly volatile, and prices change rapidly. With real-time market data, you can keep track of the latest news and price movements. You can also track your open positions, volume, market data, and other relevant data. Real-time market data is important, but it is important to remember that it is only a tool. 4. Strategy Testing Tools Have you ever wondered how a trading strategy would have performed in the past? Some platforms offer strategy testing tools that allow you to backtest your strategies. Using a strategy tester, you can test how a strategy would have performed using historical data. For instance, you can test a simple strategy where you buy a stock when it breaks out above a certain level, set a stop loss below a certain level, and sell when it reaches a specific target. Testing a strategy can help you identify whether it is profitable or not, but it is important to remember that past performance is not an indicator of future performance. 5. Portfolio & Trade Tracking Tools Trading is not just about buying and selling stocks. It is also about keeping track of your trades and analyzing your performance. Keeping a portfolio tracker and a trading journal can help you track your trades, analyze your performance, and improve as a trader. You can record your trade entry and exit prices, profit and loss, stop loss levels, position sizing, strategy, mistakes, and much more. Keeping track of your trades can help you identify what works and what doesn’t. For instance, you may realize that you are closing winning trades too early or holding on to losing trades for too long. You can then work on improving your trading behavior. How to Choose the Best Trading Software? Many beginner traders make the mistake of downloading too many trading tools and software. The more tools you have, the more complicated it can get. Instead, focus on having a few quality tools that can help you trade better. A good trading platform, a reliable charting software, a stock scanner, and risk-management tools can go a long way in your trading journey. As you grow as a trader, you can then add more tools to your arsenal. The best trading software is the one that helps you trade better. Final Thoughts Trading tools and software can make your trading process easier and more organized. From technical charting tools to stock scanners, real-time market data, strategy testers, and portfolio trackers, there are many tools that can help you trade smarter. But remember, a tool is only as good as the person using it. A scanner cannot replace market knowledge, and no indicator can predict market movement with 100% accuracy. At The Safe Trader Academy, learning to use market tools and technical analysis is just the beginning. With our trading courses, you will also learn how to develop profitable trading strategies and manage your risk better. Trade smarter with The Safe Trader Academy. Learn to analyze the market, trade better, and manage your risk. Disclaimer: Trading and investing involve market risks. The information provided above is for educational purposes only and should not be considered investment advice or a guarantee of returns. 📞 WhatsApp / Call: +91 92975 06666🌐 Website: www.thesafetrader.in
IPO Investing Guide: Things to Check Before Applying for IPO

IPO Investing Guide: Things to Check Before Applying for IPO How to Start Investing in Stocks To invest in the stock market, you might find it challenging to start with. With fluctuating stock prices, discussions around Nifty, Sensex, IPO, mutual funds, trading, and much more, it can be overwhelming to learn about stock market investing. However, if you want to learn how to start investing in the stock market for long-term gains, you have to understand the basics of stock market investing, set financial goals, and formulate a simple strategy for investing in the stock market. In this step-by-step guide, you will learn how to start investing in the stock market. What is Investing in Stocks? When you buy the stocks of a company, you are buying a small percentage of that company. This implies that if the stock price goes up, you make money. Some companies also pay dividends to their shareholders. On the contrary, if the stock price falls, the value of your investment decreases. Therefore, it is vital to know the risks involved in stock market investing. How to Start Investing in the Stock Market: A Step-By-Step Guide for Beginners Step 1: Define Financial Goals Prior to learning how to start investing in the stock market, it is essential to define financial goals. Depending on your financial needs, you may choose to invest for wealth creation, retirement, buying a house, or a car. Similarly, you may also decide to invest additionally to generate extra income. Step 2: Set Aside Funds for Emergencies Before you start investing in the stock market, it is important that you set aside funds for emergencies. This way, you do not dip into your investments during a financial emergency. Step 3: Open Demat & Trading Accounts To learn how to start investing in the stock market in India, you have to open a Demat & Trading account with a stock broker. The trading account gives you access to trade in the stock market whereas the Demat account holds your shares electronically. Once you have opened a trading account, you can start researching and investing in the stock market. Step 4: Do Not Start Blindly It is critical to understand the basics before you start investing in the stock market. Learn about market cap, revenue, EPS, P/E ratio, debt, ROE, ROCE, and dividends, among others. It is also important to learn about support and resistance and risk management to be a successful stock market investor. How to Analyze a Stock Before Investing is another vital lesson for new investors. Step 5: Research Stocks Before Investing Once you learn about stock market basics, you need to research individual stocks. For example, when comparing the stock price of two companies, say Company A and Company B, it is unwise to assume that company A is a better investment simply because its stock price is lower than that of company B. Instead, it is essential to look at the business model, financials, and prospects of a company. It is also important to consider the valuation, management, strengths, weaknesses, opportunities, and threats of the company. In short, you need to know how a company makes money, how much money it makes, how efficient it is compared to its competitors, how much debt it takes, who its competitors are, whether it is overvalued or undervalued, and its potential risks. This is commonly known as fundamental analysis. Step 6: Do Not Invest Heavily in One Stock As a new investor, it is advisable to avoid putting all your eggs in one basket. This implies that you should not invest all your money in one stock. If anything, it is a good idea to spread your investments so that if one stock falls, others may rise. In other words, you need to diversify your stock market investments. However, make sure you do not over-diversify your portfolio since it will be next to impossible to monitor your stocks. Ideally, diversify your stocks within different sectors. It is important to note that diversification cannot protect you from market risks. Step 7: Start Small and Be Disciplined How to start investing in the stock market? Begin with small amounts of money so that you can also learn the art of investing. In other words, do not put all your money in the stock market. This way, you will also be able to save some money. If you are a new investor and want to invest consistently, consider using SIPs to invest in mutual funds. They allow you to invest small amounts of money consistently. Simply put, they promote disciplined investing. Therefore, if you want to learn more about SIPs, how they work, and their benefits, check our SIP Investment: How Systematic Investment Plans Help Build Long-Term Wealth article. The key is to develop a simple but effective stock market investment strategy and stick to it. Step 8: Take a Long-Term View When learning how to start investing in the stock market, bear in mind that the stock market is a long-term wealth creation avenue. It is normal to witness the stock market experience ups and downs. In some cases, the stock market can also get stuck in a range. Therefore, it is important to take a long-term view and avoid getting emotional about short-term fluctuations in stock prices. Remember to always focus on your financial goals. Common Mistakes to Avoid as a New Investor As a new investor, it is advisable to avoid these common mistakes: Buying stocks from rumors or the recommendation of friends and family Following social media influencers and buying stocks based on their recommendation Investing blindly without learning the fundamentals of stock market investing Putting all your eggs in one basket Trying to get rich overnight Ignoring valuation Panic selling during a market crash Investing money you need in the short term Checking your portfolio too often Confusing trading with investing Conclusion Learning how to invest in the stock market course does not necessarily require you to know everything
How to Start Investing in Stocks: A Step-By-Step Guide for Beginners

How to Start Investing in Stocks To invest in the stock market, you might find it challenging to start with. With fluctuating stock prices, discussions around Nifty, Sensex, IPO, mutual funds, trading, and much more, it can be overwhelming to learn about stock market investing. However, if you want to learn how to start investing in the stock market for long-term gains, you have to understand the basics of stock market investing, set financial goals, and formulate a simple strategy for investing in the stock market. In this step-by-step guide, you will learn how to start investing in the stock market. What is Investing in Stocks? When you buy the stocks of a company, you are buying a small percentage of that company. This implies that if the stock price goes up, you make money. Some companies also pay dividends to their shareholders. On the contrary, if the stock price falls, the value of your investment decreases. Therefore, it is vital to know the risks involved in stock market investing. How to Start Investing in the Stock Market: A Step-By-Step Guide for Beginners Step 1: Define Financial Goals Prior to learning how to start investing in the stock market, it is essential to define financial goals. Depending on your financial needs, you may choose to invest for wealth creation, retirement, buying a house, or a car. Similarly, you may also decide to invest additionally to generate extra income. Step 2: Set Aside Funds for Emergencies Before you start investing in the stock market, it is important that you set aside funds for emergencies. This way, you do not dip into your investments during a financial emergency. Step 3: Open Demat & Trading Accounts To learn how to start investing in the stock market in India, you have to open a Demat & Trading account with a stock broker. The trading account gives you access to trade in the stock market whereas the Demat account holds your shares electronically. Once you have opened a trading account, you can start researching and investing in the stock market. Step 4: Do Not Start Blindly It is critical to understand the basics before you start investing in the stock market. Learn about market cap, revenue, EPS, P/E ratio, debt, ROE, ROCE, and dividends, among others. It is also important to learn about support and resistance and risk management to be a successful stock market investor. How to Analyze a Stock Before Investing is another vital lesson for new investors. Step 5: Research Stocks Before Investing Once you learn about stock market basics, you need to research individual stocks. For example, when comparing the stock price of two companies, say Company A and Company B, it is unwise to assume that company A is a better investment simply because its stock price is lower than that of company B. Instead, it is essential to look at the business model, financials, and prospects of a company. It is also important to consider the valuation, management, strengths, weaknesses, opportunities, and threats of the company. In short, you need to know how a company makes money, how much money it makes, how efficient it is compared to its competitors, how much debt it takes, who its competitors are, whether it is overvalued or undervalued, and its potential risks. This is commonly known as fundamental analysis. Step 6: Do Not Invest Heavily in One Stock As a new investor, it is advisable to avoid putting all your eggs in one basket. This implies that you should not invest all your money in one stock. If anything, it is a good idea to spread your investments so that if one stock falls, others may rise. In other words, you need to diversify your stock market investments. However, make sure you do not over-diversify your portfolio since it will be next to impossible to monitor your stocks. Ideally, diversify your stocks within different sectors. It is important to note that diversification cannot protect you from market risks. Step 7: Start Small and Be Disciplined How to start investing in the stock market? Begin with small amounts of money so that you can also learn the art of investing. In other words, do not put all your money in the stock market. This way, you will also be able to save some money. If you are a new investor and want to invest consistently, consider using SIPs to invest in mutual funds. They allow you to invest small amounts of money consistently. Simply put, they promote disciplined investing. Therefore, if you want to learn more about SIPs, how they work, and their benefits, check our SIP Investment: How Systematic Investment Plans Help Build Long-Term Wealth article. The key is to develop a simple but effective stock market investment strategy and stick to it. Step 8: Take a Long-Term View When learning how to start investing in the stock market, bear in mind that the stock market is a long-term wealth creation avenue. It is normal to witness the stock market experience ups and downs. In some cases, the stock market can also get stuck in a range. Therefore, it is important to take a long-term view and avoid getting emotional about short-term fluctuations in stock prices. Remember to always focus on your financial goals. Common Mistakes to Avoid as a New Investor As a new investor, it is advisable to avoid these common mistakes: Buying stocks from rumors or the recommendation of friends and family Following social media influencers and buying stocks based on their recommendation Investing blindly without learning the fundamentals of stock market investing Putting all your eggs in one basket Trying to get rich overnight Ignoring valuation Panic selling during a market crash Investing money you need in the short term Checking your portfolio too often Confusing trading with investing Conclusion Learning how to invest in the stock market course does not necessarily require you to know everything about the stock market. To learn how to start