Mumbai, February 20, 2025 – APAR Industries Limited, a key player in the global energy sector, is set to showcase its latest innovations at Elecrama 2025, one of the world’s largest electrical exhibitions. The event will be held from February 22 to 26 at the India Expo Mart, Greater Noida, where APAR will be present as an Associate Sponsor. Attendees can explore the company’s range of products and solutions at Hall 1, Booth A24.
With a history spanning over 66 years, APAR has established itself as a leader in conductors, cables, and specialty oils, playing a crucial role in India’s energy infrastructure. The company has built a reputation for technological advancements and sustainable practices, ensuring its solutions align with the growing demands of the global energy market.
A Global Leader in Energy Solutions
APAR Industries is recognized for its market leadership across multiple segments:
The world’s largest manufacturer of aluminium and alloy conductors.
India’s leading producer and exporter of specialty and renewable cables.
The only Indian company offering integrated copper and fibre hybrid cable solutions.
Third-largest manufacturer of transformer oils worldwide.
One of the top 10 players in India’s lubricants industry.
Showcasing Advanced Technology
At Elecrama 2025, APAR will highlight its latest developments in:
Conductors
As the world’s largest manufacturer of aluminium and alloy conductors, APAR offers high-performance solutions engineered for modern power grids. These include: HTLS ConductorACCC® AZR™SUPER-ZAD, TP, OPGW, OPPC, and CTC Conductors
Specialty Cables
The company remains India’s largest producer of specialty cables, catering to power transmission, renewable energy, railways, and industrial applications. The lineup includes:
Solar cables built for durability and efficiency
Submarine and underwater cables
EV charging cables
High-performance rail signaling and instrumentation cables
Specialty Oils & Lubricants
APAR continues to expand its lubricants and specialty oils portfolio, featuring:
India’s widest range of transformer oils under the POWEROIL brand High-performance lubricants for industrial and automotive applications Next-generation oils designed for electric vehicles (EVs)
Expanding Beyond Manufacturing
In addition to its product offerings, APAR provides comprehensive EPC (Engineering, Procurement, and Construction) solutions. This includes: Turnkey conductor solutions, ensuring seamless integration into modern power grids EPC services for cable infrastructure, including airport lighting, hybrid mining, and anti-theft cabling systems Industry training programs designed to share expertise with energy professionals at Elecrama 2025 Participants interested in attending APAR’s training sessions can register at APAR Elecrama Training.
Commitment to Growth and Innovation
“Elecrama 2025 is a great opportunity for APAR to reinforce its commitment to India’s power sector. We are excited to showcase solutions that drive efficiency, sustainability, and innovation,” said Mr. Kushal Desai, Chairman & Managing Director, APAR Industries Limited.
About APAR Industries Limited
Founded in 1958, APAR Industries operates in over 140 countries, serving transformer OEMs, power utilities, EPC contractors, automotive manufacturers, and telecom companies worldwide. With 11 manufacturing plants and a strong focus on R&D, APAR continues to deliver high-quality solutions designed to meet the evolving needs of the global energy sector.
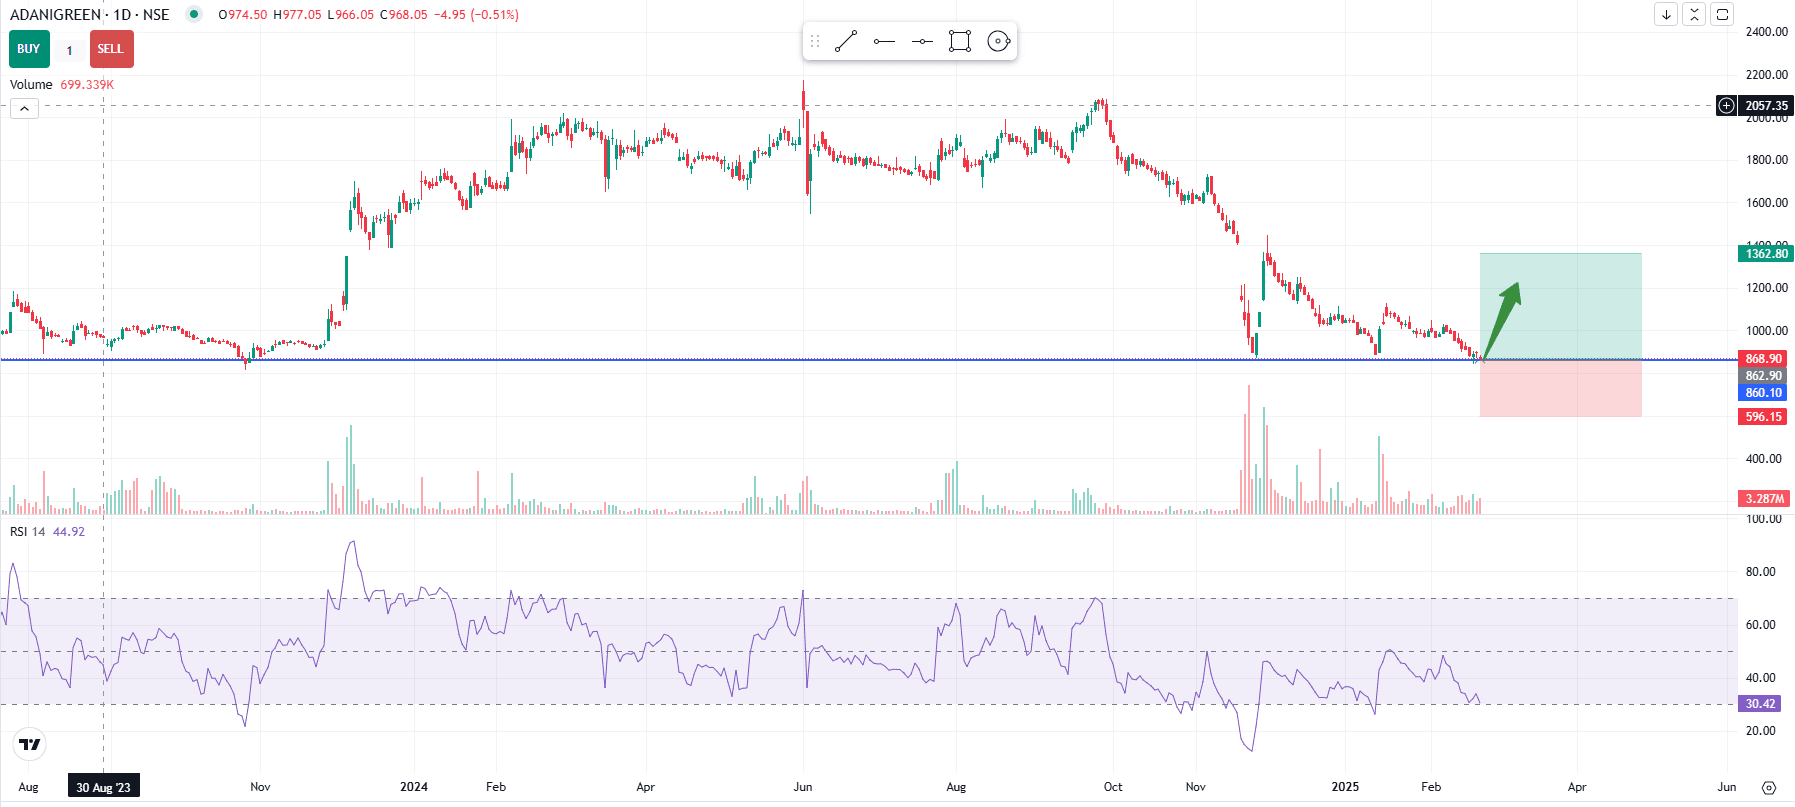
Adani Green Energy Ltd (NSE: ADANIGREEN) is trading near a crucial support level of ₹860. Will this lead to a bullish reversal? Explore key technical levels, RSI analysis, risk-reward potential, and expert insights on whether it’s the right time to buy.
Stock Market Outlook and Analysis
Shares of Adani Green Energy Ltd (NSE: ADANIGREEN) have been in a sharp downtrend, currently trading at ₹866.85, down 3.42% in the latest session. However, technical indicators suggest that the stock is nearing a crucial support level, increasing the likelihood of a strong reversal.
Key Technical Levels & Market Observations
📉 Support Level: ₹860-₹862 (Highlighted in blue) 📈 Potential Upside Target: ₹1,362 ⚠️ Stop Loss: ₹596
1. Strong Support Zone Holding Firm
The stock has reached a historically significant support level around ₹860, which has acted as a solid base in previous rallies. If this support holds, we may witness a bullish reversal in the coming sessions.
2. RSI Signaling an Oversold Condition
The Relative Strength Index (RSI) is currently at 30.20, indicating that the stock is in oversold territory. This suggests a potential rebound, as buyers may step in to accumulate shares at lower levels.
3. Risk-Reward Ratio Favors an Upside Move
A bullish risk-reward setup is forming, with the target zone (green area) around ₹1,362, representing a potential 57% upside. To manage downside risk, the stop-loss level is placed at ₹596.
Market Sentiment & Future Outlook
✅ Positive Triggers:
If buying activity increases around the support zone, a rebound towards ₹1,000–₹1,362 is likely.
Institutional investors may re-enter at these levels, boosting momentum.
❌ Downside Risks:
If the stock breaks below ₹860, further downside toward ₹600 could follow.
Broader market weakness may delay a potential recovery.
Final Call: Should You Buy ADANIGREEN?
With technical indicators signaling a possible reversal, Adani Green Energy presents an attractive opportunity for short-term traders and long-term investors. However, traders should closely monitor the ₹860 support level before making any moves.
📊 Traders’ Take: If the stock holds above ₹860, consider a long position targeting ₹1,362, while maintaining a strict stop-loss at ₹596.
💡 Investors’ Perspective: A gradual accumulation strategy may be beneficial for long-term growth, given Adani Green’s strong fundamentals in the renewable energy sector.
🚀 Watch for buying momentum and volume confirmation before entering a trade!
Now are you ready to secure your own financial future? Join The Safe Trader Academy, first-ever live Forex & Crypto Trading Workshop in Kalaburagi – March 8th & 9th, 2025! Beginner or aspiring trader looking to improve his trade. This course will help you become a professional trader through a proper roadmap.
Why This Workshop is a Game-Changer?
Trading can be extremely rewarding, whether Forex or Cryptocurrency. However, these rewards come when one has the right information, tools, and strategy. This training has been designed specifically to train potential Forex and Cryptocurrency traders with vital skills in ease of trading in this market.
>> Learn from industry experts with real-world trading experience >> Get hands-on training in live markets >> Master Forex & Crypto trading strategies from basics to advanced techniques >> Discover risk and money management secrets to protect your capital >> Gain exclusive access to pro trading tools and strategies
This workshop is for those looking to understand every nook and cranny of all things trading:
>> Forex and Crypto Basics and Advanced Strategies – Understanding currency pairs, market trends, and technical analysis. >> Money & Risk Management – Learn to minimize losses and maximize profits through expert techniques. >> Live Market Trading & Algo-Trading – Trade in real-time with professional guidance. >> Hedging, Stop-loss, Lot Sizes & More! – Get an understanding of risk management tools at a very high level. >> Get Access to Professional Trading Tools & Strategies – Learn how professional traders make informed decisions.
Meet Mr. Mallinath Mulage, CEO & Founder, The Safe Trader
With over 5+ years of hands-on experience in the stock and derivatives markets, Mr. Mallinath Mulage is a seasoned professional dedicated to empowering traders and investors. His expertise spans across research analysis, equity derivatives, commodity derivatives, and mutual funds. A skilled communicator, Mr. Mulage has trained over 2000+ individuals in diverse languages, making complex financial concepts accessible to all. Whether you’re just starting or refining your strategies, Mr. Mulage’s guidance will help you navigate the world of trading with confidence.
Why You Should Attend:
>> Learn trading from scratch to professional level >> Learn from professional traders >> Hands-on experience with live trading sessions >> Get exclusive trading tools and advanced strategies >> Network with peers and experts in trading
Conclusion
This workshop will be a one-of-a-kind chance to learn Forex and Cryptocurrency trading in-depth under the guidance of an expert. Under Mallinath Mulage, you will learn to trade in Forex and train to attain consistency in profit-making and risk management.
Don’t miss out on this amazing opportunity!Register nowto secure your spot and start your journey towards mastering the markets.
Intraday and Forex trading are exciting yet challenging arenas where traders aim to make quick profits by exploiting short-term price movements. However, many beginners and even seasoned traders often commit common mistakes that can lead to significant losses. Learning from the experiences of successful traders and mentors can help you avoid these pitfalls and improve your trading outcomes. Here are the key trading mistakes to avoid:
1. Lack of a Trading Plan
Many traders jump into the market without a well-defined trading plan. A trading plan outlines your:
Entry and exit strategies.
Risk management rules.
Profit targets.
Preferred trading hours.
Lesson: Always have a structured trading plan and stick to it to avoid impulsive decisions.
2. Overtrading
Overtrading is a common mistake, especially in intraday trading. Traders often execute too many trades, driven by overconfidence or the desire to recover losses. In India specially on expiry days of NIFTY & BANK NIFTY options trading.
Lesson: Focus on quality over quantity. Trade only when you see a high-probability setup.
3. Ignoring Risk Management
Failing to manage risk is one of the biggest reasons for losses in trading. Risk management involves setting stop-loss levels and not risking more than a small percentage of your capital on a single trade.
Lesson: Follow the “2% rule”: Never risk more than 2% of your trading capital on any single trade.
4. Emotional Trading
Fear and greed are two emotions that often drive traders to make poor decisions. Fear can prevent you from entering a trade, while greed can lead to holding onto trades for too long.
Lesson: Stay disciplined and follow your trading plan. Use tools like stop-loss orders to minimize the impact of emotions.
5. Chasing the Market
Many traders get tempted to jump into a trade after seeing a sudden price movement, often resulting in buying at the peak or selling at the bottom.
Lesson: Avoid chasing the market. Wait for the price to pull back to a support or resistance level before entering.
6. Not Understanding Leverage
Forex trading offers high leverage, which can amplify both profits and losses. Misusing leverage can wipe out your trading account quickly.
Lesson: Use leverage cautiously and understand its implications on your trading capital.
7. Skipping Technical and Fundamental Analysis
Trading without analyzing market conditions is like gambling. Intraday traders often rely on technical analysis, while Forex traders need to combine technical and fundamental analysis for better decision-making.
Lesson: Study price charts, indicators, and news events to make informed trading decisions.
8. Lack of Patience
Many traders enter trades out of impatience, even when the market doesn’t meet their criteria.
Lesson: Patience is a key virtue in trading. Wait for the right opportunities to present themselves.
9. Holding onto Losing Trades
Some traders hold onto losing trades, hoping the market will reverse, which often leads to larger losses.
Lesson: Accept small losses and move on. Use stop-loss orders to limit your risk.
10. Ignoring Market News and Events
In Forex trading, economic events like interest rate decisions, inflation reports, and geopolitical events significantly impact currency prices.
Lesson: Stay updated with market news and have an economic calendar handy to anticipate potential market-moving events.
11. Trading Without a Demo Account
Many beginners skip the demo trading phase and start trading with real money without understanding the market dynamics.
Lesson: Practice on a demo account to test your strategies and build confidence before trading with real money.
12. Unrealistic Expectations
Expecting to become a millionaire overnight is a recipe for disappointment. Trading requires time, effort, and continuous learning.
Lesson: Set realistic goals and focus on consistent, small gains rather than chasing huge profits.
13. Not Reviewing Past Trades
Failing to analyze past trades can prevent you from identifying patterns in your trading behavior, both good and bad.
Lesson: Maintain a trading journal to review your trades and learn from your mistakes.
14. Neglecting Forex-Specific Strategies
Forex trading requires specific strategies, such as understanding currency pairs, the impact of global markets, and overnight swap rates.
Lesson: Learn and adapt Forex-specific strategies to improve your trading outcomes.
Conclusion
Avoiding these common trading mistakes can help you preserve your capital, build confidence, and pave the way for long-term success. Intraday and Forex trading require discipline, continuous learning, and the ability to adapt to changing market conditions. By learning from experienced traders and mentors, you can develop the skills and mindset needed to thrive in these dynamic markets. Remember, trading is a journey, not a sprint—stay patient and committed to your goals.
Disclaimer
Trading involves significant financial risk and may not be suitable for all investors. This article is for educational purposes only and does not constitute financial advice. Always consult with a professional advisor before making trading decisions.
TradingView is a powerful platform for traders and investors, offering a wide range of chart types to analyze the markets. Choosing the right chart type is crucial as it affects how you interpret market movements and make trading decisions. In this article, we’ll explore the most popular chart types available on TradingView, their uses, and which chart might be best suited for entry-level traders and professionals.
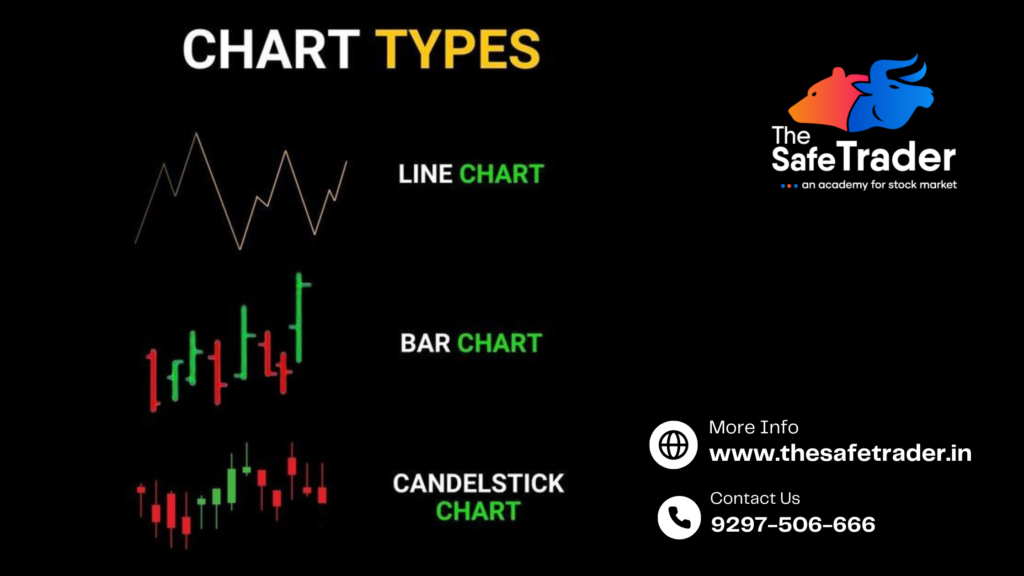
1. Line Chart
Overview: A Line Chart connects the closing prices of a stock or asset over a specific period, creating a simple line.
Best for:
Entry-Level Traders: Ideal for beginners as it provides a clean, clutter-free view of price trends.
Analyzing long-term trends.
Pros:
Simple and easy to understand.
Highlights the general direction of the market.
Cons:
Lacks detailed information like open, high, and low prices.
2. Bar Chart
Overview: A Bar Chart displays price information using vertical bars for each time period, indicating the open, high, low, and close (OHLC) prices.
Best for:
Intermediate traders who want to understand market volatility.
Visualizing price ranges and trends.
Pros:
Detailed representation of price movement.
Useful for identifying trend reversals.
Cons:
May appear cluttered to beginners.
3. Candlestick Chart
Overview: The Candlestick Chart is one of the most widely used chart types. It uses candles to show OHLC prices within a specific period, with the body of the candle representing the price range between the open and close.
Best for:
All Levels of Traders: Beginners to professionals can benefit from its clear representation of market sentiment.
Analyzing market trends, patterns, and reversals.
Pros:
Easy to spot bullish and bearish trends.
Rich visual representation of price action.
Patterns like Doji, Hammer, and Engulfing provide actionable insights.
Cons:
Requires a learning curve to master candlestick patterns.
4. Heikin-Ashi Chart
Overview: The Heikin-Ashi Chart smoothens price data to create a clearer view of trends, making it easier to identify trend direction without much noise.
Best for:
Professional traders looking for trend-following strategies.
Swing and positional traders.
Pros:
Filters out market noise.
Helps in identifying trends and reversals clearly.
Cons:
Does not show exact prices (open, high, low, close).
5. Renko Chart
Overview: Renko Charts focus on price movement rather than time, with “bricks” appearing when the price moves a certain amount.
Best for:
Professional traders focused on reducing noise and tracking trends.
Identifying support and resistance levels.
Pros:
Eliminates market noise.
Clear trend signals.
Cons:
Ignores time, which might be important for certain trading strategies.
6. Point & Figure Chart
Overview: Point & Figure Charts focus solely on price movement and ignore time and volume. They use “X” and “O” to represent upward and downward movements.
Best for:
Traders analyzing long-term price trends and breakout points.
Pros:
Excellent for identifying breakout levels.
Reduces market noise.
Cons:
Not ideal for short-term trading.
7. Area Chart
Overview: Similar to the Line Chart but with a shaded area beneath the line to emphasize the trend.
Best for:
Entry-level traders who prefer a visual representation of trends.
Long-term investors.
Pros:
Simple and visually appealing.
Highlights trends over time.
Cons:
Lacks detailed information.
Which Chart Type is Most Useful?
For Entry-Level Traders: Line Charts or Area Charts are the simplest to start with as they emphasize trends without overwhelming detail. Once comfortable, beginners can transition to Candlestick Charts for more in-depth analysis.
For Professional Traders: Heikin-Ashi, Renko, and Point & Figure Charts are preferred for their ability to filter noise and highlight clear trends. Professional traders also use Candlestick Charts extensively for precision trading.
For Intraday Traders: Candlestick Charts and Heikin-Ashi Charts are popular for intraday trading as they help identify short-term price movements and trends.
For Swing/Positional Traders: Renko and Heikin-Ashi Charts are effective in identifying longer-term trends and reducing market noise.
Which Chart Type is Most Accurate?
Accuracy depends on your trading strategy. Candlestick Charts are considered reliable for most trading styles due to their detailed price representation. However, Renko and Heikin-Ashi Charts are more accurate for trend-following strategies as they filter out noise.
Which Chart Type Can You Trust?
All chart types are trustworthy if you use them correctly. The choice depends on your trading goals:
Use Candlestick Charts for detailed analysis and pattern recognition.
Use Heikin-Ashi Charts or Renko Charts for smooth trend visualization.
Beginners should start with Line Charts to build confidence.
Conclusion
TradingView offers a variety of chart types to cater to different trading styles and skill levels. Beginners can start with Line or Candlestick Charts, while professionals can explore advanced options like Heikin-Ashi and Renko Charts. Remember, no chart is inherently better than another—it’s about aligning the chart type with your trading strategy and goals.
TradingView is a powerful platform for traders and investors, offering a wide range of chart types to analyze the markets. Choosing the right chart type is crucial as it affects how you interpret market movements and make trading decisions. In this article, we’ll explore the most popular chart types available on TradingView, their uses, and which chart might be best suited for entry-level traders and professionals.
1. Line Chart
Overview: A Line Chart connects the closing prices of a stock or asset over a specific period, creating a simple line.Best for:
Entry-Level Traders: Ideal for beginners as it provides a clean, clutter-free view of price trends.
Analyzing long-term trends.
Pros:
Simple and easy to understand.
Highlights the general direction of the market.
Cons:
Lacks detailed information like open, high, and low prices.
2. Bar Chart
Overview: A Bar Chart displays price information using vertical bars for each time period, indicating the open, high, low, and close (OHLC) prices.
Best for:
Intermediate traders who want to understand market volatility.
Visualizing price ranges and trends.
Pros:
Detailed representation of price movement.
Useful for identifying trend reversals.
Cons:
May appear cluttered to beginners.
3. Candlestick Chart
Overview: The Candlestick Chart is one of the most widely used chart types. It uses candles to show OHLC prices within a specific period, with the body of the candle representing the price range between the open and close.
Best for:
All Levels of Traders: Beginners to professionals can benefit from its clear representation of market sentiment.
Analyzing market trends, patterns, and reversals.
Pros:
Easy to spot bullish and bearish trends.
Rich visual representation of price action.
Patterns like Doji, Hammer, and Engulfing provide actionable insights.
Cons:
Requires a learning curve to master candlestick patterns.
4. Heikin-Ashi Chart
Overview: The Heikin-Ashi Chart smoothens price data to create a clearer view of trends, making it easier to identify trend direction without much noise.
Best for:
Professional traders looking for trend-following strategies.
Swing and positional traders.
Pros:
Filters out market noise.
Helps in identifying trends and reversals clearly.
Cons:
Does not show exact prices (open, high, low, close).
5. Renko Chart
Overview: Renko Charts focus on price movement rather than time, with “bricks” appearing when the price moves a certain amount.
Best for:
Professional traders focused on reducing noise and tracking trends.
Identifying support and resistance levels.
Pros:
Eliminates market noise.
Clear trend signals.
Cons:
Ignores time, which might be important for certain trading strategies.
6. Point & Figure Chart
Overview: Point & Figure Charts focus solely on price movement and ignore time and volume. They use “X” and “O” to represent upward and downward movements.
Best for:
Traders analyzing long-term price trends and breakout points.
Pros:
Excellent for identifying breakout levels.
Reduces market noise.
Cons:
Not ideal for short-term trading.
7. Area Chart
Overview: Similar to the Line Chart but with a shaded area beneath the line to emphasize the trend.
Best for:
Entry-level traders who prefer a visual representation of trends.
Long-term investors.
Pros:
Simple and visually appealing.
Highlights trends over time.
Cons:
Lacks detailed information.
Which Chart Type is Most Useful?
For Entry-Level Traders: Line Charts or Area Charts are the simplest to start with as they emphasize trends without overwhelming detail. Once comfortable, beginners can transition to Candlestick Charts for more in-depth analysis.
For Professional Traders: Heikin-Ashi, Renko, and Point & Figure Charts are preferred for their ability to filter noise and highlight clear trends. Professional traders also use Candlestick Charts extensively for precision trading.
For Intraday Traders: Candlestick Charts and Heikin-Ashi Charts are popular for intraday trading as they help identify short-term price movements and trends.
For Swing/Positional Traders: Renko and Heikin-Ashi Charts are effective in identifying longer-term trends and reducing market noise.
Which Chart Type is Most Accurate?
Accuracy depends on your trading strategy. Candlestick Charts are considered reliable for most trading styles due to their detailed price representation. However, Renko and Heikin-Ashi Charts are more accurate for trend-following strategies as they filter out noise.
Which Chart Type Can You Trust?
All chart types are trustworthy if you use them correctly. The choice depends on your trading goals:
Use Candlestick Charts for detailed analysis and pattern recognition.
Use Heikin-Ashi Charts or Renko Charts for smooth trend visualization.
Beginners should start with Line Charts to build confidence.
Conclusion
TradingView offers a variety of chart types to cater to different trading styles and skill levels. Beginners can start with Line or Candlestick Charts, while professionals can explore advanced options like Heikin-Ashi and Renko Charts. Remember, no chart is inherently better than another—it’s about aligning the chart type with your trading strategy and goals.
Discontinuation of Weekly Derivatives Contracts on Bank Nifty, Midcap Nifty, and FinNifty: A New Chapter in Indian Markets
The Securities and Exchange Board of India (SEBI) has made a groundbreaking decision to discontinue weekly derivatives contracts for Bank Nifty, Midcap Nifty, and Finnifty indices, effective November 20, 2024. This move, aimed at protecting small traders from excessive losses, marks a significant shift in the trading landscape.
The Indian financial markets are witnessing a paradigm shift as the SEBI introduces significant reforms to the derivatives trading segment. Let’s dive into the details.
Why SEBI Took This Bold Step
The SEBI’s decision stems from a stark reality: while derivatives trading has boomed in recent years, retail traders have borne the brunt of substantial losses. According to SEBI’s study, only 7.2% of individual traders profited in derivatives trading over the past three years, while the remaining 92.8% collectively lost a staggering ₹1.81 lakh crore between FY22 and FY24. This concerning trend prompted SEBI to introduce stricter regulations to:
Protect small and retail investors.
Reduce market speculation and volatility.
Encourage long-term, sustainable wealth creation.
The Rise and Fall of Weekly Expiry Contracts
Since their launch by the National Stock Exchange (NSE) in 2016, weekly expiry contracts—especially Bank Nifty—have been a cornerstone of India’s derivatives market. Retail traders were drawn to these contracts for their affordability, high liquidity, and potential for quick returns. By the first half of FY25, Bank Nifty alone accounted for nearly 47.5% of NSE’s weekly options premium turnover, reflecting its dominance.
Key Highlights of the New Rules
One Weekly Expiry Contract Per Exchange
Post-November 20, 2024, only one weekly expiry will be allowed per exchange.
NSE: Weekly expiry for the Nifty 50 Index every Thursday.
BSE: Weekly expiry for the Sensex Index every Friday.
Weekly expiry contracts for Bank Nifty, Midcap Select, FinNifty, and others will no longer be available.
Increased Contract Sizes
SEBI has mandated that index derivatives must have a minimum contract value of ₹15 lakh.
This translates to higher lot sizes:
Nifty 50: Lot size increases from 25 to 75.
Bank Nifty: Lot size increases from 15 to 30.
Phased Discontinuation
The last trading dates for the discontinued weekly index options are:
Bank Nifty (BANKNIFTY) – Last expiry: November 13, 2024
Midcap Nifty (MIDCPNIFTY) – Last expiry: November 18, 2024
Finnifty (FINNIFTY) – Last expiry: November 19, 2024
4. Focus on Monthly Expiry Contracts
With weekly options discontinued for popular indices, traders are expected to pivot towards monthly contracts, which are generally less volatile and provide a more stable trading environment.
Impact on the Market
Immediate Effects
Reduced Volumes: Bank Nifty weekly options alone accounted for 47.5% of NSE’s weekly options premium turnover in the first half of FY25, contributing ₹25.96 trillion. Their absence is expected to drastically reduce overall trading volumes.
Shift in Strategies: High-frequency traders (HFTs) and retail participants will need to adapt by exploring monthly options or stock-based derivatives.
Increased Costs: Larger contract sizes and reduced leverage may deter small traders, limiting participation to those with higher capital.
Shift in Trader Behavior: Retail traders, who were the primary participants in weekly options trading due to its affordability, may now explore stock-based options or margin trading facilities.
Impact on Traders and Brokers
For Traders:
Retail traders, who drove the popularity of Bank Nifty weekly options, may shift their focus to monthly expiries, stock-based options, or margin trading facilities (MTF).
The increased contract size will likely deter small traders, limiting derivatives trading to those with higher capital reserves.
For Brokers:
Brokers like Zerodha and other high-volume trading platforms estimate significant revenue impacts, with up to 60% of derivatives activity potentially affected.
Market Behavior:
High-frequency trading strategies may see a decline, and the market could experience reduced volatility as speculative activity wanes.
Long-Term Implications
While the immediate reaction to these changes may involve reduced liquidity and trading volumes, experts believe the long-term outcomes could be positive:
Stability Over Speculation: By curbing speculative fervor, SEBI aims to align trading behavior with long-term investment goals, reducing overall market volatility.
Diversification of Trades: Traders may pivot to other instruments such as margin trading facilities (MTF), individual stock options, or cash equities.
Brokerage Revenues: Brokers heavily reliant on derivatives trading volumes, such as Zerodha, anticipate significant revenue impacts.
Risk Mitigation: By discouraging speculative trading, SEBI’s measures aim to reduce the alarming losses faced by retail traders, fostering a healthier trading ecosystem.
Farewell to Bank Nifty Weekly Options
The Bank Nifty weekly contract has been a favorite among traders since its launch in 2016, driving significant growth in the derivatives market. Its discontinuation marks the end of an era, but also a new beginning for India’s financial markets. As SEBI pushes for a more structured and risk-conscious trading environment, the focus shifts from short-term gains to sustainable investment practices. Bank Nifty weekly options have been the cornerstone of NSE’s derivatives segment, celebrated for their liquidity and affordability. Over the years, they have attracted millions of retail traders, becoming synonymous with high-frequency trading. However, their high-risk nature led to outsized losses for retail participants, making them a focal point of SEBI’s reforms.
The Bigger Picture: From Speculation to Wealth Creation
SEBI’s regulatory changes signify a paradigm shift toward investor protection and long-term wealth creation. By steering traders away from speculative trading, the market watchdog aims to foster a culture of disciplined investment.
Potential Benefits
Lower Risk Exposure: Higher contract sizes and fewer derivatives options may limit impulsive trading and speculative losses.
Focus on Cash Equities: A reduced emphasis on F&O trading may encourage investments in equities, which historically yield better long-term returns.
Market Maturity: A stable derivatives market could attract institutional investors and boost confidence among long-term market participants.
What’s Next for Traders?
For active traders, the discontinuation of weekly expiry contracts represents both a challenge and an opportunity. Here’s what they can do:
Adapt Strategies: Shift focus to monthly options and explore strategies that align with the new framework.
Leverage Education: Equip themselves with knowledge on stock-based options, technical analysis, and risk management to thrive in the evolving market.
Diversify Portfolios: Consider diversifying into cash equities, mutual funds, or ETFs for sustained wealth creation.
A New Chapter for the Indian Market
The discontinuation of weekly derivatives contracts for Bank Nifty, Midcap Nifty, and Finnifty signals the end of an era. While it may initially disrupt trading strategies and volumes, SEBI’s proactive measures prioritize investor protection and long-term market health. As the market adapts to these changes, traders and brokers alike will need to rethink their approaches, paving the way for a more resilient and inclusive financial ecosystem.
Conclusion
The discontinuation of weekly derivatives contracts on Bank Nifty, Midcap Nifty, and FinNifty marks the end of an era and the beginning of a more regulated, investor-friendly market. While the short-term impact may be disruptive, SEBI’s measures aim to build a robust financial ecosystem that balances growth with risk management. As traders and investors navigate these changes, adaptability and a focus on long-term goals will be key to success in the new market landscape.
Stay tuned as we explore the evolving landscape of India’s derivatives market in the coming months!
The Importance of Technical Analysis in Modern Stock Market Trading: A Must-Learn for Every Trader and Investor
In today’s fast-paced financial markets, technical analysis has become an indispensable tool for traders and investors alike. With advancements in technology and the increasing complexity of financial instruments, learning modern techniques of technical analysis is not just a choice but a necessity for anyone serious about navigating the stock market effectively.
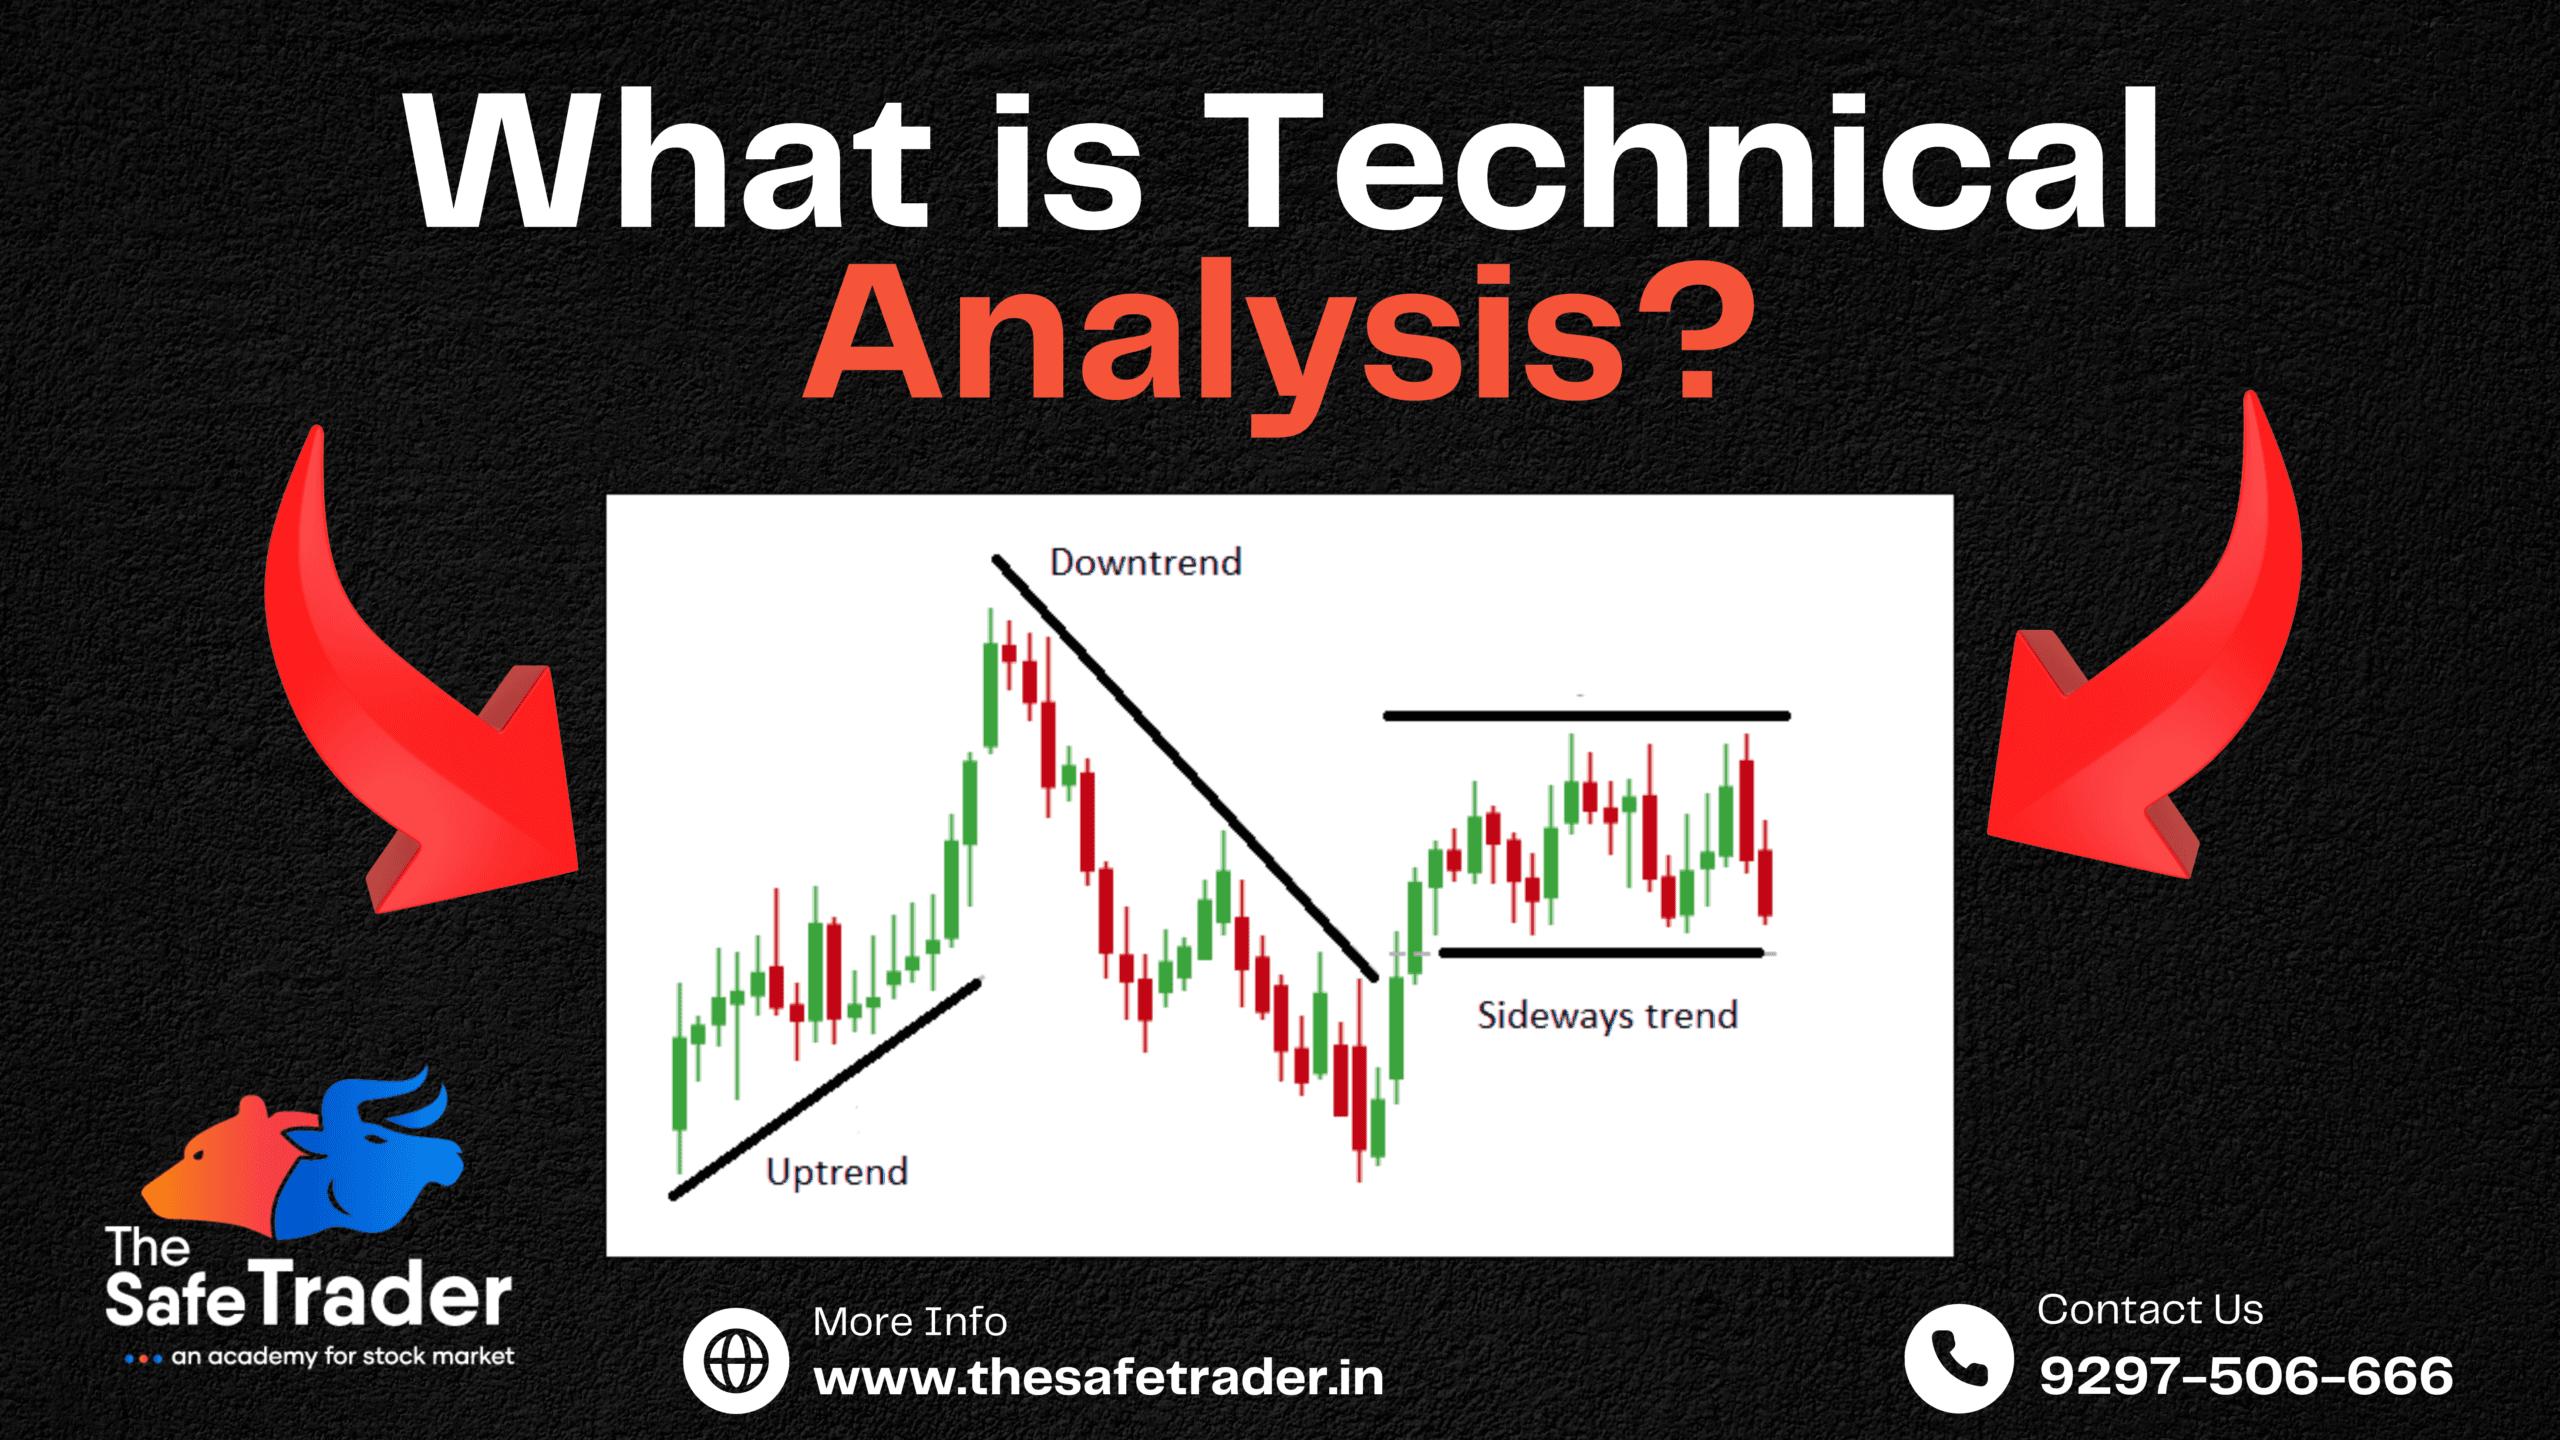
What is Technical Analysis?
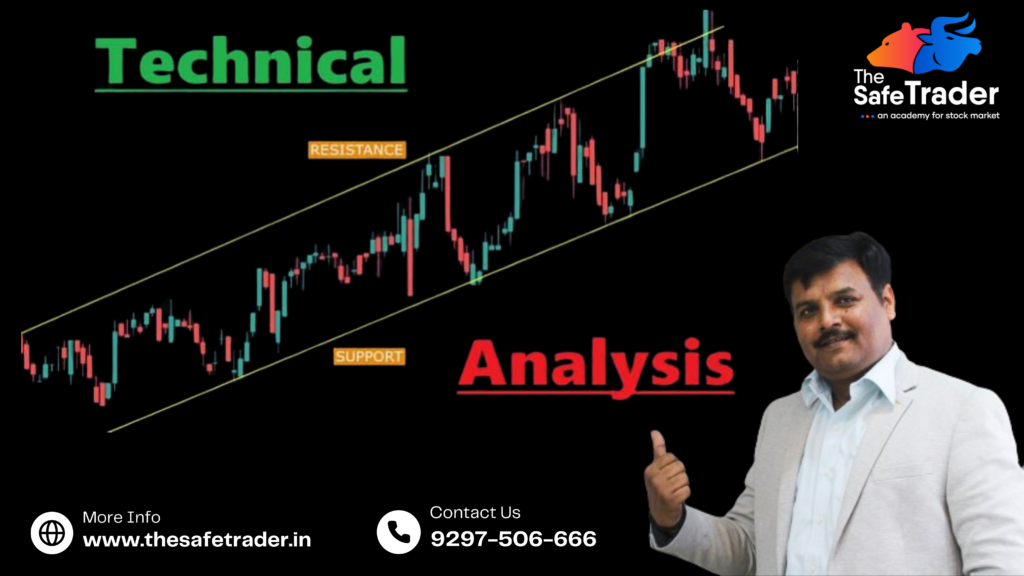
Technical analysis is a method of evaluating financial markets by analyzing historical price movements, trading volumes, and patterns. Unlike fundamental analysis, which focuses on the intrinsic value of a stock, technical analysis is rooted in the belief that all market information is already reflected in the price. Traders use charts, indicators, and patterns to predict future price movements and identify optimal entry and exit points.
Why Should Every Trader and Investor Learn Modern Techniques?
Data-Driven Decisions Modern trading requires data-backed strategies to minimize risks and maximize returns. Technical analysis equips traders with tools to make informed decisions, rather than relying on guesswork or emotions.
Adaptability to Market Conditions Markets are ever-changing, with trends, volatility, and economic factors playing significant roles. Learning modern techniques helps traders adapt to these changes and find opportunities in various market conditions.
Universal Applicability Technical analysis is not limited to stocks. It can be applied across asset classes, including commodities, forex, options, and cryptocurrencies, making it a versatile skill.
Key Roles of Technical Analysis
Trend Identification: It helps in spotting upward, downward, or sideways trends early, allowing traders to align their strategies accordingly.
Risk Management: By setting stop-loss and target levels, technical analysis ensures disciplined trading.
Market Timing: Identifying overbought or oversold conditions enables traders to time their entries and exits more effectively.
Advantages of Technical Analysis
Improved Accuracy in Entry and Exit Points Technical analysis helps traders identify the best price levels to buy or sell. For instance, support and resistance levels often act as pivot points in the market.
Emotion Control Emotions like fear and greed can cloud judgment. Technical analysis provides a structured approach to trading, reducing the influence of emotions.
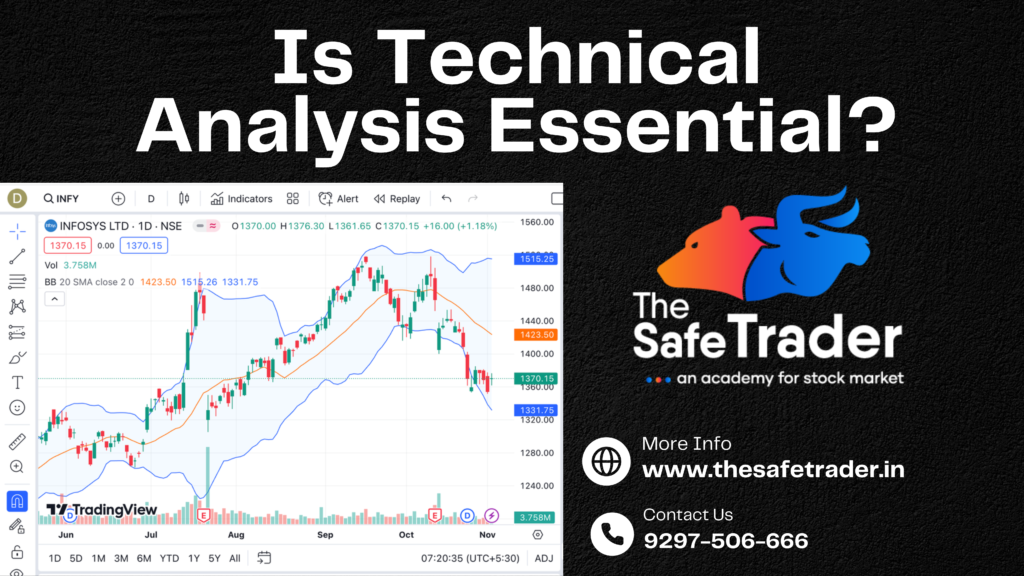
Enhanced Profitability By using technical indicators like moving averages, RSI, MACD, and Bollinger Bands, traders can increase the probability of successful trades.
Time Efficiency Technical analysis tools allow traders to quickly analyze market conditions, saving valuable time compared to fundamental analysis.
Identifying Trends One of the core principles of Technical Analysis is recognizing trends—whether bullish, bearish, or sideways. Knowing the market’s direction helps align your strategies for maximum gain.
Risk Management Tools like stop-loss orders and support/resistance levels, derived from Technical Analysis, help minimize risks and protect capital.
Predicting Market Reversals Indicators like RSI, MACD, and moving averages provide insights into potential reversals, ensuring you’re not caught off-guard.
Saving Time Technical Analysis focuses on actionable data, allowing traders to make quick, informed decisions rather than spending hours analyzing financial statements.
New Strategies in Technical Analysis
Modern technical analysis incorporates advanced strategies, such as:
Algorithmic Trading: Leveraging AI and algorithms to automate trading based on technical patterns.
Smart Money Concepts (SMC): Understanding institutional order flow and liquidity areas.
Volume-Weighted Indicators: Using tools like VWAP to gauge institutional activity.
Multiple Time Frame Analysis: Cross-verifying signals across different time frames for better accuracy.
How to Apply Technical Analysis in Trading
Start with Charts: Use charting platforms like TradingView to analyze price movements and draw trendlines.
Learn Indicators: Understand how popular indicators like RSI, MACD, and Fibonacci retracement work.
Combine Strategies: Use a combination of trend-following and counter-trend strategies for better results.
Practice Discipline: Always stick to your trading plan and avoid impulsive decisions.
Is Technical Analysis Essential?
For traders, technical analysis is essential as it provides actionable insights for short-term decisions. For investors, understanding technical analysis can complement fundamental research, especially when timing market entries and exits. While it’s not a guarantee for success, it significantly increases the likelihood of making informed and profitable decisions.
Should Every Investor and Trader Learn Modern Techniques?
The short answer is: Yes. Modern trading has evolved with technology, and integrating advanced techniques has become more critical than ever. Here’s why:
High-Speed Trading: Algorithms and AI-based strategies dominate today’s markets. To stay competitive, understanding how these systems operate is essential.
Access to Tools: Platforms now offer sophisticated tools and indicators, but using them effectively requires knowledge of Technical Analysis.
Dynamic Market Conditions: Global economic changes, geopolitical tensions, and technological advancements create fluctuations. Being equipped with modern techniques ensures you’re ready for any scenario.
Will It Help You Enter at the Best Price?
One of the biggest advantages of technical analysis is its ability to highlight optimal entry points. By understanding support levels, candlestick patterns, and momentum indicators, traders can enter trades at favorable prices and maximize their potential returns.
Conclusion
In the modern financial landscape, technical analysis is not just a skill but a necessity for anyone looking to succeed in the stock market. Whether you’re a novice or an experienced trader, mastering technical analysis can provide a significant edge. By leveraging its tools and strategies, you can make data-driven decisions, manage risk effectively, and control emotions, ultimately becoming a more confident and successful market participant.
Start your journey with technical analysis today, and unlock the door to smarter and more strategic trading!
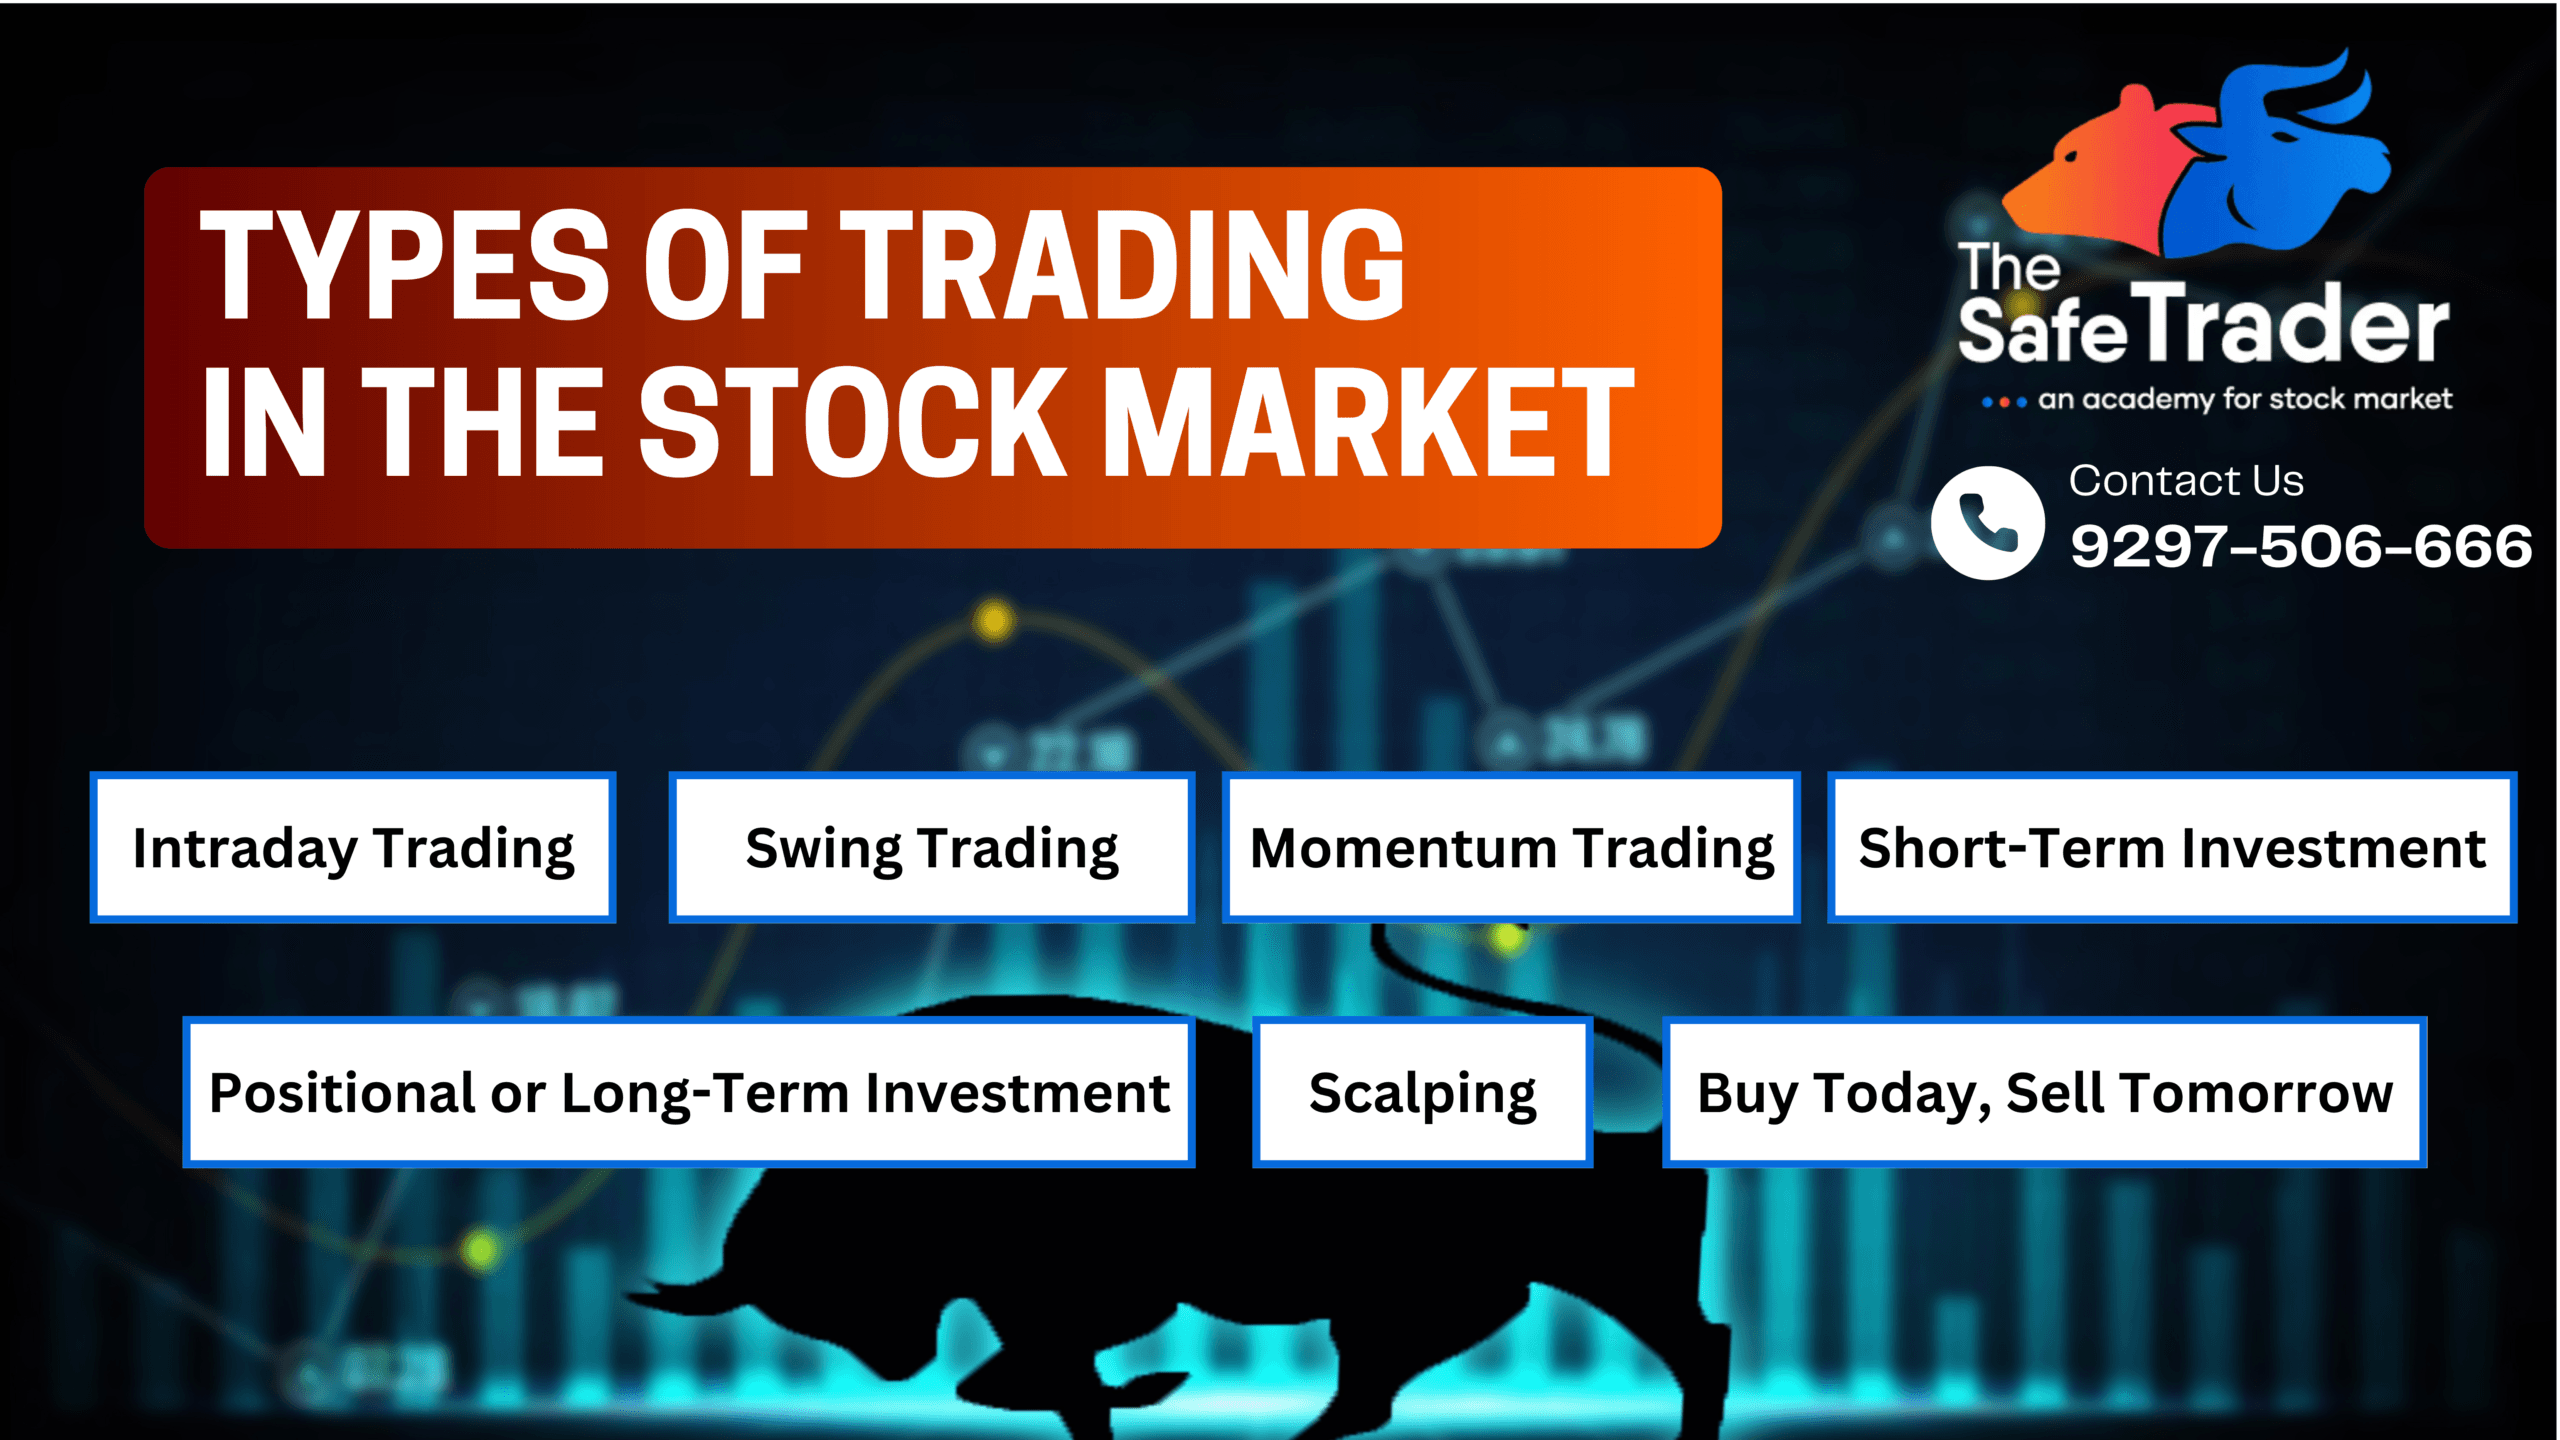
Trading in the stock market involves buying and selling shares with the intent to profit from market fluctuations. Different trading types cater to diverse strategies, timeframes, and goals, allowing investors to tailor their approach according to their risk tolerance, financial goals, and available time.
Trading in the stock market offers a variety of styles, each suited to different risk appetites, time commitments, and market analysis approaches. Here’s a breakdown of some of the most popular trading methods, along with examples to help you understand each one better.
1. Intraday Trading
Definition: Intraday trading, also known as day trading, involves buying and selling stocks within the same trading day. Traders do not hold positions overnight, aiming instead to profit from short-term price movements.
Example: Suppose a trader buys shares of Company XYZ at ₹200 per share in the morning and sells them at ₹210 before the market closes. The ₹10 per share difference represents their intraday profit.
Who It’s For: This approach is suitable for traders who can actively monitor the market throughout the day and are comfortable with quick decision-making.
Risks: Intraday trading can be risky, as prices fluctuate throughout the day. It requires a strong grasp of technical analysis and market indicators.
Characteristics:
Requires constant monitoring and quick decision-making.
Best for individuals with time to track the market closely.
High potential for profit, but also risk due to short holding periods.
2. BTST (Buy Today, Sell Tomorrow)
Definition: BTST trading refers to buying shares today and selling them the next trading day without taking delivery. Traders aim to capitalize on short-term momentum, predicting that the stock price will rise the next day.
Example: If a trader buys 100 shares of Company ABC on Monday at ₹150, they may plan to sell it on Tuesday if they anticipate a price rise based on news or technical indicators.
Who It’s For: BTST is suitable for traders who want to capture overnight momentum without holding the stock long-term.
Risks: Stock prices can gap down due to overnight events, so BTST trading involves a level of risk from price fluctuations between closing and opening prices.
Characteristics:
Capitalizes on overnight price movements.
Helps avoid additional costs associated with holding stocks longer.
Suitable for traders who follow news events and technical analysis.
3. Swing Trading
Definition: Swing trading involves holding stocks for several days to weeks, aiming to profit from medium-term price fluctuations. Swing traders often rely on technical analysis to identify entry and exit points.
Example: A trader buys shares of Company XYZ at ₹500, expecting the price to reach ₹550 over the next two weeks. Once the price target is achieved, the trader exits the trade.
Who It’s For: This strategy suits traders who cannot monitor the market constantly but have a good understanding of technical indicators and patterns.
Risks: Market volatility or unexpected news can disrupt the planned swing, potentially leading to losses if the trader is not able to adjust their position.
Characteristics:
Balances the need for quick profits and longer holding periods.
Ideal for traders with some experience in market analysis.
Allows traders to capitalize on more pronounced price movements.
4. Short-Term Investment
Definition: Short-term investing involves holding stocks for a few months to a year. Investors typically look for undervalued stocks that they believe will increase in value over the short term.
Example: An investor buys shares of a pharmaceutical company ahead of expected approval for a new drug, hoping to see an increase in the stock price over six months.
Who It’s For: Short-term investments are ideal for those who can wait a few months and have moderate risk tolerance, often relying on both technical and fundamental analysis.
Risks: Short-term investments can be affected by quarterly earnings, regulatory changes, and sector-specific news, which might lead to volatility.
Characteristics:
Less time-intensive than day or swing trading.
Involves understanding market trends, news, and financial reports.
Suitable for those looking for medium returns without frequent trading.
5. Positional or Long-Term Investment
Definition: Positional or long-term investing involves holding stocks for several years, often based on fundamental analysis. Long-term investors look for growth companies or blue-chip stocks that can appreciate in value over time.
Example: An investor buys shares of a large tech company with a solid track record and holds onto it for five years, during which the stock value grows significantly due to the company’s consistent growth and innovation.
Who It’s For: This approach is for investors with a long-term horizon and a high tolerance for market fluctuations, as they are prepared to weather short-term volatility for the potential of larger gains.
Risks: Long-term investments are susceptible to market cycles, economic downturns, and industry shifts that could affect the company’s growth over the years.
Characteristics:
Low-stress approach focused on strong, fundamentally sound companies.
Requires less time monitoring market fluctuations.
Aims at wealth creation over time rather than quick gains.
6. Momentum Trading
Definition: Momentum trading involves buying stocks that are showing strong upward trends and selling them when the momentum begins to fade. This style of trading relies heavily on market sentiment and technical indicators like moving averages.
Example: A momentum trader notices that Company XYZ’s stock has been gaining steadily for the past month, driven by strong quarterly earnings. They buy shares, expecting the upward trend to continue, and sell once indicators show that the momentum is slowing.
Who It’s For: This approach is suitable for traders who closely follow technical indicators and are comfortable taking on moderate risk in pursuit of quick profits.
Risks: Momentum trading can be risky if the trend reverses unexpectedly, leading to potential losses for those unable to exit quickly.
Characteristics:
Involves quick entry and exit points to capitalize on trends.
Requires a strong understanding of market indicators and timing.
Risky due to potential for rapid trend reversals.
7. Scalping
Definition: Scalping is a fast-paced trading strategy where traders aim to make small, quick profits from tiny price changes. Scalpers may make dozens or even hundreds of trades in a single day, closing each position within minutes or even seconds.
Example: A scalper buys shares of Company ABC at ₹150.01 and sells them a few seconds later at ₹150.05. While the profit per share is small, repeating this process multiple times can add up to significant gains.
Who It’s For: Scalping is for traders who are highly disciplined, quick at executing trades, and have the ability to focus intensely for extended periods.
Risks: Scalping requires substantial knowledge of the market and rapid decision-making skills. High transaction costs and minor missteps can erode profits quickly.
Characteristics:
Highly active and requires swift decisions.
Suitable for experienced traders with access to fast trading platforms.
Generates profit through high-frequency trades with minimal price changes.
Choosing the Right Trading Style
The right trading style depends on your risk tolerance, time availability, and trading knowledge. Here’s a summary to help you decide:
Intraday Trading: High-frequency, requires constant monitoring and technical skills.
Scalping: Very high-frequency, for those adept at quick decisions and rapid market analysis.
Each style has unique advantages and challenges, so understanding your financial goals, risk tolerance, and available time is crucial. Remember that no single style guarantees success, and continuous learning and practice are essential for any trader. Whether you’re a quick-paced scalper or a patient long-term investor, the stock market offers multiple paths to explore.
Why Choose The Safe Trader Academy?
At The Safe Trader Academy, we pride ourselves on our team of NISM-certified professionals, including Equity F&O Traders, Commodity Derivatives Traders, Investment Advisors, and Research Analysts. Our group of seasoned traders and trainers is dedicated to providing top-notch stock market training in Hyderabad and beyond.
Multiple Branches: With over five branches across Telangana and Kalaburagi, quality education is accessible wherever you are.
Comprehensive Curriculum: Our courses cover everything from the basics of derivative trading to advanced strategies in options and futures.
Expert Guidance: Learn from industry experts with real-world trading experience.
The Difference Between Trading and Investing: A Guide for Beginners
The financial markets have always attracted individuals seeking to grow their wealth, but there’s often confusion about the difference between trading and investing. In this article, we’ll break down what sets these two approaches apart, the unique benefits and risks of each, and how to decide which might be best suited for your financial goals.
Introduction to Trading and Investing
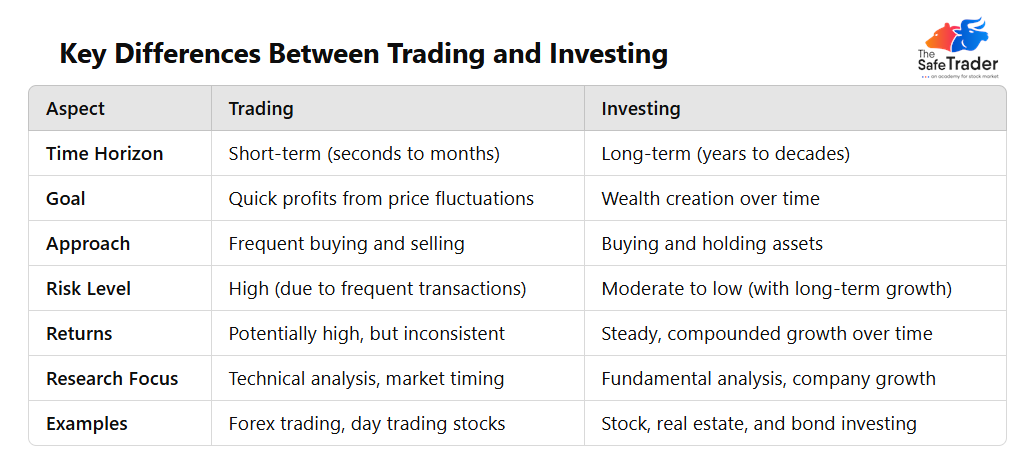
Trading and investing are terms frequently used interchangeably, but they signify distinct strategies for building wealth. While both revolve around buying and selling assets to generate returns, the key difference lies in the time horizon and the approach to risk and reward.
What is Trading?
Trading is the practice of buying and selling financial instruments, such as stocks, commodities, currencies, or derivatives, within a short time frame. The goal of trading is to make quick profits by capitalizing on short-term price fluctuations.
Time Horizon: Traders often hold assets for days, hours, or even seconds, depending on the chosen strategy (e.g., day trading, swing trading, or scalping).
Market Focus: Traders rely heavily on technical analysis, reading charts and using indicators to predict price movements and make rapid decisions.
High Risk-Reward Ratio: Trading can offer high rewards but comes with increased risk. Prices can be highly volatile, and small movements can lead to either profits or losses.
Key Characteristics of Trading
Short-Term Focus: The primary objective is to profit from short-term fluctuations in asset prices.
Technical Analysis: Traders rely heavily on charts, indicators, and technical analysis to identify potential opportunities.
High Risk, High Reward: The potential for significant returns is accompanied by the possibility of substantial losses, often requiring skill and experience to mitigate risks.
Active Management: Traders need to be constantly aware of market conditions, news, and data, making trading a demanding activity that requires time and focus.
What is Investing?
Investing, on the other hand, is about purchasing assets to hold them for the long term, typically years or even decades. The objective of investing is to grow wealth gradually over time by capitalizing on the asset’s potential appreciation and compounding growth.
Time Horizon: Investors buy assets intending to hold them long-term, betting on their intrinsic value and the overall market growth.
Market Focus: Investors tend to focus on fundamental analysis—evaluating the company’s financial health, growth potential, and industry position.
Lower Risk, Steady Returns: Although investing generally involves less short-term risk, it also requires patience as returns accumulate over years.
Investing is a strategy focused on building wealth over the long term by purchasing assets and holding them with a long-term horizon. Investors purchase stocks, bonds, real estate, or mutual funds to achieve gradual growth over several years or even decades. The goal of investing is not just to generate capital appreciation but also to receive dividends, interest, or rental income over time.
Types of Investing
Value Investing: Investors focus on undervalued stocks that are believed to be trading below their intrinsic value.
Growth Investing: This strategy targets companies that are expected to grow at an above-average rate compared to others in the industry.
Income Investing: Investors purchase assets such as dividend-paying stocks or bonds that generate a steady income stream.
Key Characteristics of Investing
Long-Term Horizon: Investors aim for slow and steady gains over the years, typically holding their positions for several years to even decades.
Fundamental Analysis: Investing decisions are often based on fundamentals, including a company’s financials, earnings, future growth potential, and overall market conditions.
Lower Risk, Lower Reward: Compared to trading, investing carries relatively lower risk, with the goal of preserving capital while growing it slowly.
Passive Management: Investments can be managed passively, requiring less time and energy compared to trading. Investors are more focused on the overall trend rather than daily price fluctuations.
Comparing Trading and Investing
Types of Traders and Investors
Both trading and investing have subcategories that suit different personalities, lifestyles, and risk tolerances.
Types of Traders
Day Traders: Traders buy and sell within the same day, closing all positions by the market’s close. The objective is to take advantage of small price movements throughout the day.
Swing Traders: Swing traders hold positions for a few days or weeks, seeking profits from short-term price swings.
Scalpers: Scalping involves making numerous trades to gain small profits from minor price changes
Types of Investors
Growth Investors – Focus on companies with high growth potential, willing to pay a premium.
Value Investors – Seek undervalued stocks, expecting them to reach their intrinsic value.
High Profit Potential: Trading allows for high returns due to frequent opportunities for profit.
Control and Flexibility: Traders have the ability to enter and exit positions quickly, maintaining control over their funds.
Leverage Options: Many trading platforms offer leverage, allowing traders to maximize their potential gains.
Drawbacks of Trading
Increased Risk and Stress: Trading is not only risky but can also be mentally taxing due to market volatility.
Transaction Costs: High-frequency trading can incur significant transaction fees, which can eat into profits.
Time-Intensive: Trading requires constant monitoring, analysis, and swift decision-making.
Benefits and Drawbacks of Investing
Benefits of Investing
Compounding Growth: Holding investments over time enables the power of compounding, leading to exponential growth.
Lower Risk Exposure: With a long-term view, short-term market fluctuations have less impact, reducing overall risk.
Passive Income Potential: Dividend stocks and rental properties provide regular income, contributing to wealth growth.
Drawbacks of Investing
Slow Returns: Investing is a long-term game; profits accumulate slowly and require patience.
Market Dependency: While less volatile than trading, investments are still influenced by economic cycles and may decrease in value during downturns.
Capital Requirement: Investing in quality assets often requires a significant initial investment, which may not be accessible to everyone.
Which is Right for You? Trading or Investing?
Choosing between trading and investing depends on various factors:
Financial Goals – If your objective is to grow wealth slowly and steadily, investing might be suitable. However, if you’re aiming for faster gains and have time for active management, trading could be an option.
Risk Tolerance – Trading is inherently riskier, requiring a high tolerance for market volatility, whereas investing aligns better with conservative risk tolerance.
Time Commitment – Trading demands regular time and attention, while investing can be more hands-off, with less frequent portfolio reviews.
Knowledge and Skills – Trading requires extensive knowledge of market trends and technical analysis, while investing involves understanding financial statements, market dynamics, and economic factors.
Who Should Consider Trading?
Trading is ideal for those who:
Have a deep understanding of the financial markets and technical analysis.
Are comfortable with high-risk situations and can manage stress effectively.
Have the time to actively manage and monitor trades throughout the day.
Who Should Consider Investing?
Investing is suitable for individuals who:
Prefer a less risky and more passive approach to wealth accumulation.
Are willing to remain patient to see returns over the long term.
Want to grow their wealth gradually while minimizing time commitment.
The Importance of Understanding Your Financial Goals
To determine whether trading or investing is the right fit for you, it’s essential to understand your financial goals, risk tolerance, and time horizon. If you’re seeking high returns in a short period and are comfortable with risk, trading could be the path for you. On the other hand, if you’re aiming for consistent growth over time without actively managing your portfolio every day, investing is the way to go.
Both trading and investing have their merits and drawbacks, and many successful market participants use a combination of both strategies to diversify their approaches and mitigate risks. Ultimately, your personal circumstances, time availability, and financial objectives will dictate which approach—or blend of both—suits you best.
Blending Trading and Investing Strategies
Some people prefer a hybrid approach, where they invest a portion of their portfolio for the long-term and trade with another portion to capitalize on short-term opportunities. This approach provides a balance between the growth potential of investing and the active gains of trading.
Final Thoughts: Making an Informed Decision
Both trading and investing offer viable paths to financial growth but cater to different styles and risk profiles. Trading can yield high returns quickly but comes with substantial risk, while investing provides stable growth over time with lower exposure to volatility. Ultimately, the best approach depends on individual goals, risk tolerance, and commitment.
If you’re new to the financial markets, consider starting with small investments or trading simulations to understand the dynamics before committing significant capital. Consulting with financial advisors and continuous learning are also essential as both trading and investing involve complex knowledge and strategies.
In today’s digital era, it’s easier than ever to access the tools and information needed to trade or invest. While both trading and investing can be profitable, their strategies, risks, and benefits are distinctly different.
For those new to financial markets, The Safe Trader Academy in Hyderabad offers resources, training, and guidance. Whether you want to dive into trading strategies or learn investment fundamentals, The Safe Trader Academy provides valuable support to help you achieve your financial aspirations.
FAQs
Is trading more profitable than investing?
Both can be profitable, but trading requires more skill and active management, with greater risk. Investing, while slower, generally offers steady returns over time.
Can you do both trading and investing?
Yes, many individuals choose a mix of both, using long-term investments to grow wealth and trading to capitalize on short-term market movements.
What are the risks associated with trading?
Trading risks include market volatility, emotional decision-making, leverage risks, and transaction fees, all of which can lead to substantial losses.
Which is better for beginners?
Beginners might find investing easier and more sustainable, as it involves lower risk and does not require constant market monitoring like trading.