Thesafetrader

Author: thesafetrader.in

  • Derivative Trading: A Comprehensive Guide

    Derivative Trading: A Comprehensive Guide

    Derivative Trading: A Comprehensive Guide

    What is Derivative Trading?

    In the Indian stock market, derivative trading has become an essential tool for traders and investors looking to manage risk and enhance their portfolio’s performance. Here at The Safe Trader Academy, Hyderabad, we specialize in equipping you with the knowledge and skills to navigate the complex world of derivatives trading with confidence. Our NISM-certified trainers bring extensive experience in equity, futures, options (F&O), and commodity trading, offering a comprehensive curriculum designed for both beginners and experienced traders.

    Derivative trading involves contracts whose value is derived from an underlying asset. This underlying asset can be anything from stocks and commodities to currencies and indices. Derivatives provide a unique opportunity to speculate on market movements without directly owning the underlying asset.

    Types of Derivatives:

    1. Options:

    What is an Option?

    Options are a type of derivative contract that gives the buyer the right (but not the obligation) to buy or sell an underlying asset at a predetermined price within a specific timeframe. 

    Types of Options

    In the world of options trading, there are two primary types of options: calls and puts.
    A call option gives the buyer the right to purchase the asset, while a put option gives them the right to sell it.

    Call Option: The right to buy an asset at a specified price.

    • Call Option: Gives the buyer the right, but not the obligation, to buy the underlying asset at a specified price (strike price) on or before a specific date (expiration date).

    Put Option: The right to sell an asset at a specified price.

    • Put Option: Gives the buyer the right, but not the obligation, to sell the underlying asset at a specified price (strike price) on or before a specific date (expiration date).  

    2. Futures: Contracts that obligate the buyer to purchase and the seller to sell an asset at a predetermined price on a future date. 

    These instruments include futures, options, forwards, and swaps.

    What is a Future?

    A futures contract is a derivative agreement to buy or sell an asset at a future date for a specified price. Futures are commonly used by investors to hedge risk or speculate on the direction of an asset’s price.

    What is Open Interest in Future Trading? 

    Open Interest (OI) refers to the total number of outstanding derivative contracts, such as options or futures, that have not been settled. OI is crucial in gauging the strength of a price trend in futures trading.

    Key Concepts

    • Long Buildup: Indicates buying interest; implies bullish sentiment.

    This indicates an increase in OI and price, suggesting bullish sentiment in the market.

    • Short Buildup: Indicates selling interest; implies bearish sentiment.

    An increase in OI accompanied by a decrease in price, often signaling bearish sentiment.

    • Long Unwinding: Indicates selling of previously bought positions.

    When traders start closing long positions, leading to a drop in both price and OI.

    • Short Covering: Indicates buying of previously sold positions.

    This happens when traders close short positions, which can push the price higher as the OI decreases.

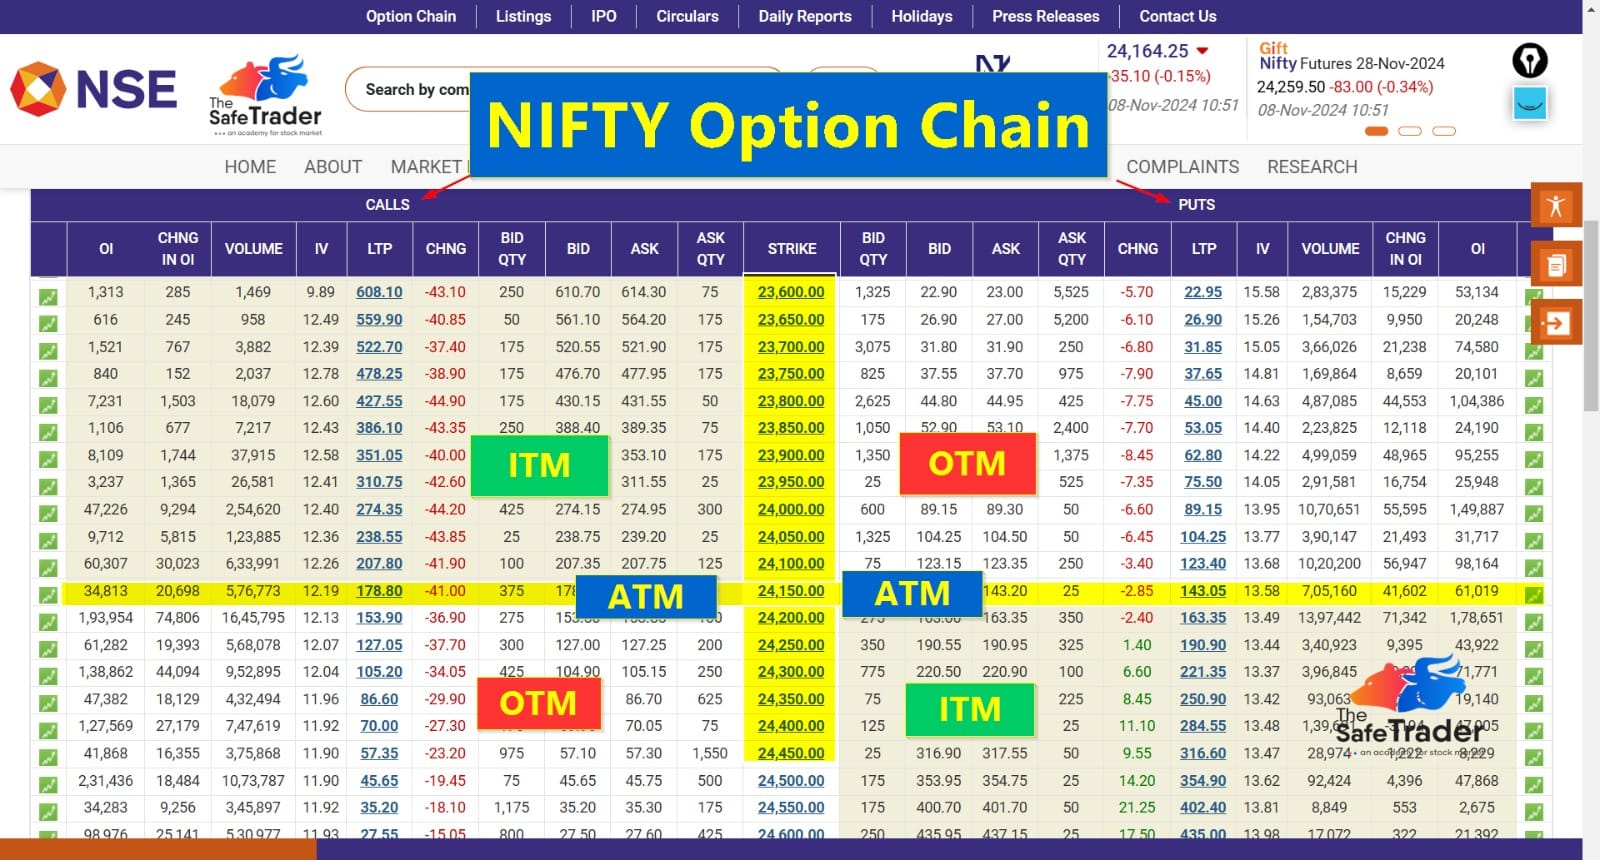
    What is an Option Chain?

    An option chain, also known as an options matrix, displays all available strike prices and premiums for a specific underlying asset. It provides a snapshot of call and put options, helping traders analyze market sentiment, volatility, and price expectations.

     A table showing the options available for a particular underlying asset, including strike prices, expiry dates, and their respective premiums.

    Key Metrics in Option Chain Analysis:

    1. Open Interest (OI): The total number of open contracts for a particular option.
      • Long Buildup: An increase in open interest for a call or put option, indicating increased buying activity.
      • Short Buildup: An increase in open interest for a call or put option, indicating increased selling activity.
      • Long Unwinding: A decrease in open interest for a call or put option, indicating decreased buying activity.
      • Short Covering: A decrease in open interest for a call or put option, indicating decreased selling activity.
    2. Put-Call Ratio (PCR): The ratio of put options to call options. A higher PCR indicates a bearish sentiment, while a lower PCR indicates a bullish sentiment.

    What is Put-Call Ratio (PCR)?
    The PCR is a sentiment indicator that compares the trading volume of put options to call options. A high PCR indicates a bearish sentiment, while a low PCR indicates a bullish sentiment.

    1. Theta Decay: The rate at which an option’s time value decays as it approaches its expiration date. Theta decay refers to the gradual erosion of an option’s value as it nears its expiration date. It’s an essential factor for options traders, especially those using short-term strategies.
    2. Delta: Measures the sensitivity of an option’s price to changes in the price of the underlying asset. For example, a delta of 0.5 means the option’s price is expected to move 50% of the movement of the asset price.

    Importance of Volume and Strike Price Selection

    • Volume: A high volume of trading in an option indicates strong interest from market participants. Volume in an options chain represents the total number of contracts traded during a given period. High volume indicates strong interest in a particular strike price and can help confirm trends.
    • Strike Price Selection: Choosing the right strike price is crucial. Consider factors like the underlying asset’s volatility, market sentiment, and your risk tolerance.

    In-the-money, at-the-money, and out-of-the-money strike prices each have their advantages.

    • Implied Volatility (IV): Represents the market’s forecast of a likely movement in the underlying asset’s price. Higher IV indicates higher expected fluctuations and can lead to higher option premiums.
    • Change in OI: Tracks the change in the number of open contracts, providing insights into market sentiment. Change in OI helps traders track shifts in sentiment by comparing the current OI with previous levels. An increase or decrease in OI provides insights into the positions held by traders in the market.

    Identifying Support & Resistance using OI Data:
    Traders use OI data to identify key support and resistance levels. High OI at a particular strike price indicates strong support or resistance.

    By analyzing OI at various strike prices, traders can identify significant support and resistance levels. High OI at a particular strike price suggests a strong barrier that the price may struggle to break.

    Who are Options Writers/Sellers?

    Options writers, or sellers, are traders who write (or sell) options contracts, earning the premium paid by the buyer. Options writers are obligated to fulfill the contract if the buyer exercises their option.

    Options writers, also known as sellers, are market participants who create and sell option contracts. They generally have deeper pockets compared to option buyers.

    Where Can I Get the Latest OI Data During Market Hours?

    Real-time OI data is available through various financial platforms and brokerage services. Access to up-to-date OI information is critical for making informed trading decisions.

    https://www.nseindia.com/get-quotes/derivatives?symbol=NIFTY

    Why Choose The Safe Trader Academy?

    Future & Options - Learn Technical Analysis

    At The Safe Trader Academy, we pride ourselves on our team of NISM-certified professionals, including Equity F&O Traders, Commodity Derivatives Traders, Investment Advisors, and Research Analysts. Our group of seasoned traders and trainers is dedicated to providing top-notch stock market training in Hyderabad and beyond.

    • Multiple Branches: With over five branches across Telangana and Kalaburagi, quality education is accessible wherever you are.
    • Comprehensive Curriculum: Our courses cover everything from the basics of derivative trading to advanced strategies in options and futures.
    • Expert Guidance: Learn from industry experts with real-world trading experience.

    Embark on your journey to financial mastery with The Safe Trader Academy. Our tailored programs and expert trainers are here to guide you every step of the way in the exciting world of derivative trading.

  • Muhurth Trading on Diwali: Significance and Tradition

    Muhurth Trading on Diwali: Significance and Tradition

    The annual tradition of Muhurat Trading is one of the most anticipated events in the Indian stock market, especially for investors who believe in the auspiciousness of Diwali. On November 1, 2024, from 6:00 PM to 7:00 PM, the Bombay Stock Exchange (BSE) and the National Stock Exchange (NSE) will hold their hour-long Muhurat Trading session, marking the beginning of the Hindu calendar year, Samvat 2081. This special session has both spiritual and financial significance, drawing a blend of faith and finance that goes back centuries.

    At The Safe Trader Academy, we celebrate the festival of Diwali every year with joy and enthusiasm. As part of our tradition, we invite all of you to join us in this celebration of wealth and prosperity. This is the perfect opportunity to start your investment journey on the auspicious occasion of Muhurth Trading. Let’s come together to make the most of this festival and begin a prosperous financial year with the blessings of Goddess Lakshmi.

    Significance

    The Significance of Muhurat Trading

    ‘Muhurat’ refers to a “auspicious moment,” a time period deemed favorable by Vedic astrology for new beginnings. In the financial world, it translates to a symbolic opening for wealth creation, prosperity, and growth. Muhurat Trading on Diwali holds a deep-rooted significance in the Hindu tradition, as it aligns with the start of the new Samvat, the Hindu calendar year. Many believe that the trades initiated during this hour will bring good fortune throughout the year.

    For investors, particularly those with a religious or cultural inclination, it is more than just a trading session. It represents a fresh beginning, reflecting on past financial performance and looking forward to new opportunities. Many traders and investors consider this the perfect time to start their investment journey, fueled by the belief that starting ventures on this day attracts wealth, success, and good luck.

    Why Do People Start Investing on Diwali According to the Hindu Calendar?

    Diwali is one of the most important festivals in the Hindu religion, celebrated as the victory of light over darkness and good over evil. The festival symbolizes new beginnings, and in the context of wealth, it is linked to the worship of Goddess Lakshmi, the deity of wealth and prosperity. It is believed that making investments or starting new ventures on Diwali invokes the blessings of Lakshmi, ensuring financial growth.

    The Hindu calendar plays a pivotal role in determining auspicious days for starting significant ventures, and Diwali marks the start of the new financial year for many in the business community. This concept of a new beginning aligns with the belief that Samvat marks a fresh cycle in the cosmos, creating a positive environment for success in financial matters.

    Rituals and Traditions Surrounding Muhurat Trading

    Several rituals are conducted during this special session, adding to its cultural and spiritual depth. Traders often begin the day with a prayer to Lord Ganesha, the remover of obstacles, and Goddess Lakshmi for prosperity. Many families and trading firms buy a small quantity of stocks as a symbolic gesture, emphasizing the idea of growth and success in the coming year.

    Over time, while the stock market has become more technologically driven and globalized, this ancient tradition has managed to keep its charm. For seasoned traders and first-time investors alike, the Muhurat Trading session is an opportunity to participate in the market with a positive mindset, hoping for a prosperous year ahead.

    The Importance of Muhurth Trading

    1. Symbol of New Beginnings: Diwali is seen as the beginning of a new year according to the Hindu calendar, especially for businesses and traders. The Muhurth Trading session symbolizes new beginnings and is believed to usher in wealth and prosperity for the upcoming year. Participating in this session is considered a gesture of faith and hope, as it is thought to set a positive tone for one’s investments.
    2. Cultural Significance: Diwali is a time for joy, celebration, and worship. During Muhurth Trading, investors believe that starting their financial activities on this auspicious occasion will bring good fortune and success. It’s not just about trading but also about reinforcing one’s cultural values and religious beliefs.
    3. Spiritual Belief in Wealth Creation: In Hindu tradition, the goddess Lakshmi is worshipped to bring wealth and prosperity into homes and businesses. Muhurth Trading is done as a tribute to her blessings. The belief is that any financial activity performed during the “muhurth” time, an auspicious period according to astrology, will be blessed with long-term gains.
    4. Low-Risk Traditions: Many investors participate in Muhurth Trading for its symbolic value rather than for substantial financial returns. Even those who refrain from regular trading often buy or sell a token number of shares as part of the tradition. This is seen as setting a financial intention rather than making aggressive market moves.

    Why Do People Start Investing on Diwali According to the Hindu Calendar?

    According to the Hindu calendar, Diwali marks the end of the harvest season and the start of the new financial year, particularly for the business community in many regions of India. This period is associated with new beginnings, prosperity, and removing obstacles from one’s financial path.

    1. Lakshmi Pujan: On Diwali, especially during Laxmi Pujan, Hindus worship Goddess Lakshmi to seek her blessings for wealth and prosperity in the coming year. This is the primary reason many people choose to start investing or initiate new financial ventures on this day. They believe that investments made during this auspicious period are bound to grow and multiply with the goddess’s blessings.
    2. Astrological Significance: Diwali, according to Hindu astrology, falls during an auspicious time of the year when the planets and stars align favorably for wealth accumulation and success. The specific “muhurth” chosen for the trading session is considered astrologically powerful for initiating new ventures and investments, bringing in long-term positive outcomes.
    3. Setting Financial Intentions: Just as people make resolutions at the start of a new calendar year, Muhurth Trading is about setting financial goals and intentions for the coming year. The act of investing during this session is symbolic of making a fresh start, aligning one’s financial activities with the auspicious energies of the day.
    4. The Tradition of ‘Chopda Pujan’: Diwali is also a time for Chopda Pujan or the worship of business ledgers. In many traditional families, this day marks the closure of old accounts and the start of new ones. In modern times, investors and traders replace these ledgers with their investment portfolios, praying for growth in their financial holdings.

    Conclusion

    Muhurth Trading during Diwali is not just about participating in the stock market; it’s about embracing new financial opportunities with optimism, grounded in cultural and spiritual beliefs. As the BSE and NSE host this annual session on November 1, 2024, it marks not only the start of Samvat 2081 but also the belief in the power of auspicious beginnings. By participating, traders align themselves with a centuries-old tradition that blends faith, finance, and fortune, hoping to bring wealth and success into their lives for the new year ahead.


  • How to Use Trading View Like a Pro Trader?

    How to Use Trading View Like a Pro Trader?

    TradingView –
    Every Trader must know this software

    Comprehensive Trading Platform for Traders: Features and Benefits

    Introduction

    In today’s fast-paced financial markets, traders and investors need access to advanced tools and real-time data to make informed decisions. Whether you’re a novice or an expert, having a powerful trading platform with extensive features can elevate your trading experience. This article dives into the essential features of a trading platform, showcasing everything from alerts to comprehensive financial analysis and how it supports your trading journey.

    Description

    A modern trading platform offers a suite of tools and functionalities to streamline the trading process. From paper trading to advanced charting options, these platforms provide everything a trader needs to make strategic moves in the stock market, Forex, and even cryptocurrency exchanges. Whether you’re analyzing institutional data or setting alerts for real-time updates, the features available cater to every trader’s needs.

    Advantages

    The key advantage of using an advanced trading platform lies in its versatility and range of tools. Users can access multiple world exchanges, analyze economic data, and even collaborate with a community of like-minded traders. The ability to integrate custom indicators and use strategy testers for backtesting provides traders with an edge in designing and executing strategies. Platforms that offer both free and paid premium features ensure that users can choose the right tools based on their level of expertise and trading goals.

    Paper Trading

    One of the standout features is paper trading, which allows traders to simulate trades without risking actual capital. This is ideal for beginners learning the ropes or for experienced traders testing new strategies in a risk-free environment.

    Alerts

    Real-time alerts are crucial for staying on top of market movements. Most platforms offer customizable alert functions that notify traders of price changes, market news, or strategy triggers via email, push notifications, or SMS.

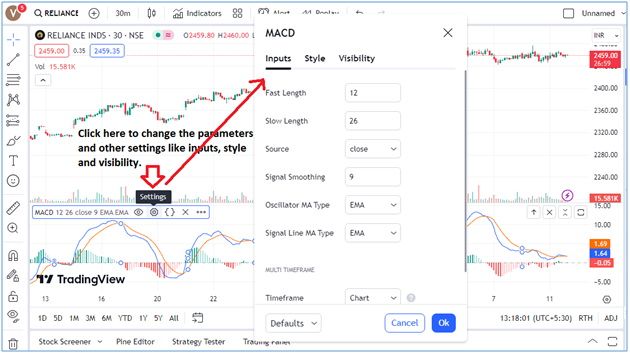
    Research Tools and Custom Indicators

    Trading Academy

    Comprehensive research tools and the ability to integrate custom indicators give traders insights into market trends. These tools help analyze price movements, trading volume, and market sentiment, enabling more accurate decision-making.

    Fundamental Information About Stocks

    Access to detailed fundamental information about stocks, including financial statements, ratios, and earnings reports, ensures that traders can evaluate the intrinsic value of stocks before making a trade.

    Stock Screener Functionality

    Stock screener functionality allows traders to filter through thousands of stocks based on specific criteria such as price, market cap, and technical indicators. This saves time and provides targeted opportunities for investment.

    Strategy Tester for Back testing

    The strategy tester is an indispensable tool for traders to backtest their strategies using historical data. This feature allows traders to simulate how their strategy would have performed in past market conditions, ensuring it’s robust before using it in live trading.

    Trading Panels

    Trading panels offer direct access to place and manage trades within the platform, making the trading process seamless. With panels designed for different markets (stocks, forex, crypto), users can quickly execute trades with real-time data.

    Advanced Level Chart Types

    A variety of chart types, from candlestick to Renko, help traders visualize market trends in ways that suit their strategy. Advanced charting tools are indispensable for technical analysis, enabling traders to spot patterns and trends.

    Paid Premium Features and Free Options

    Many platforms offer a mix of free and premium features. Free users often have access to basic tools, while premium subscriptions unlock advanced functionalities such as custom indicators, deeper research tools, and additional data access.

    Institutional Data

    Institutional data, such as large-volume trades and hedge fund movements, is invaluable for understanding market trends and positioning your trades effectively. This feature helps traders track the actions of institutional investors.

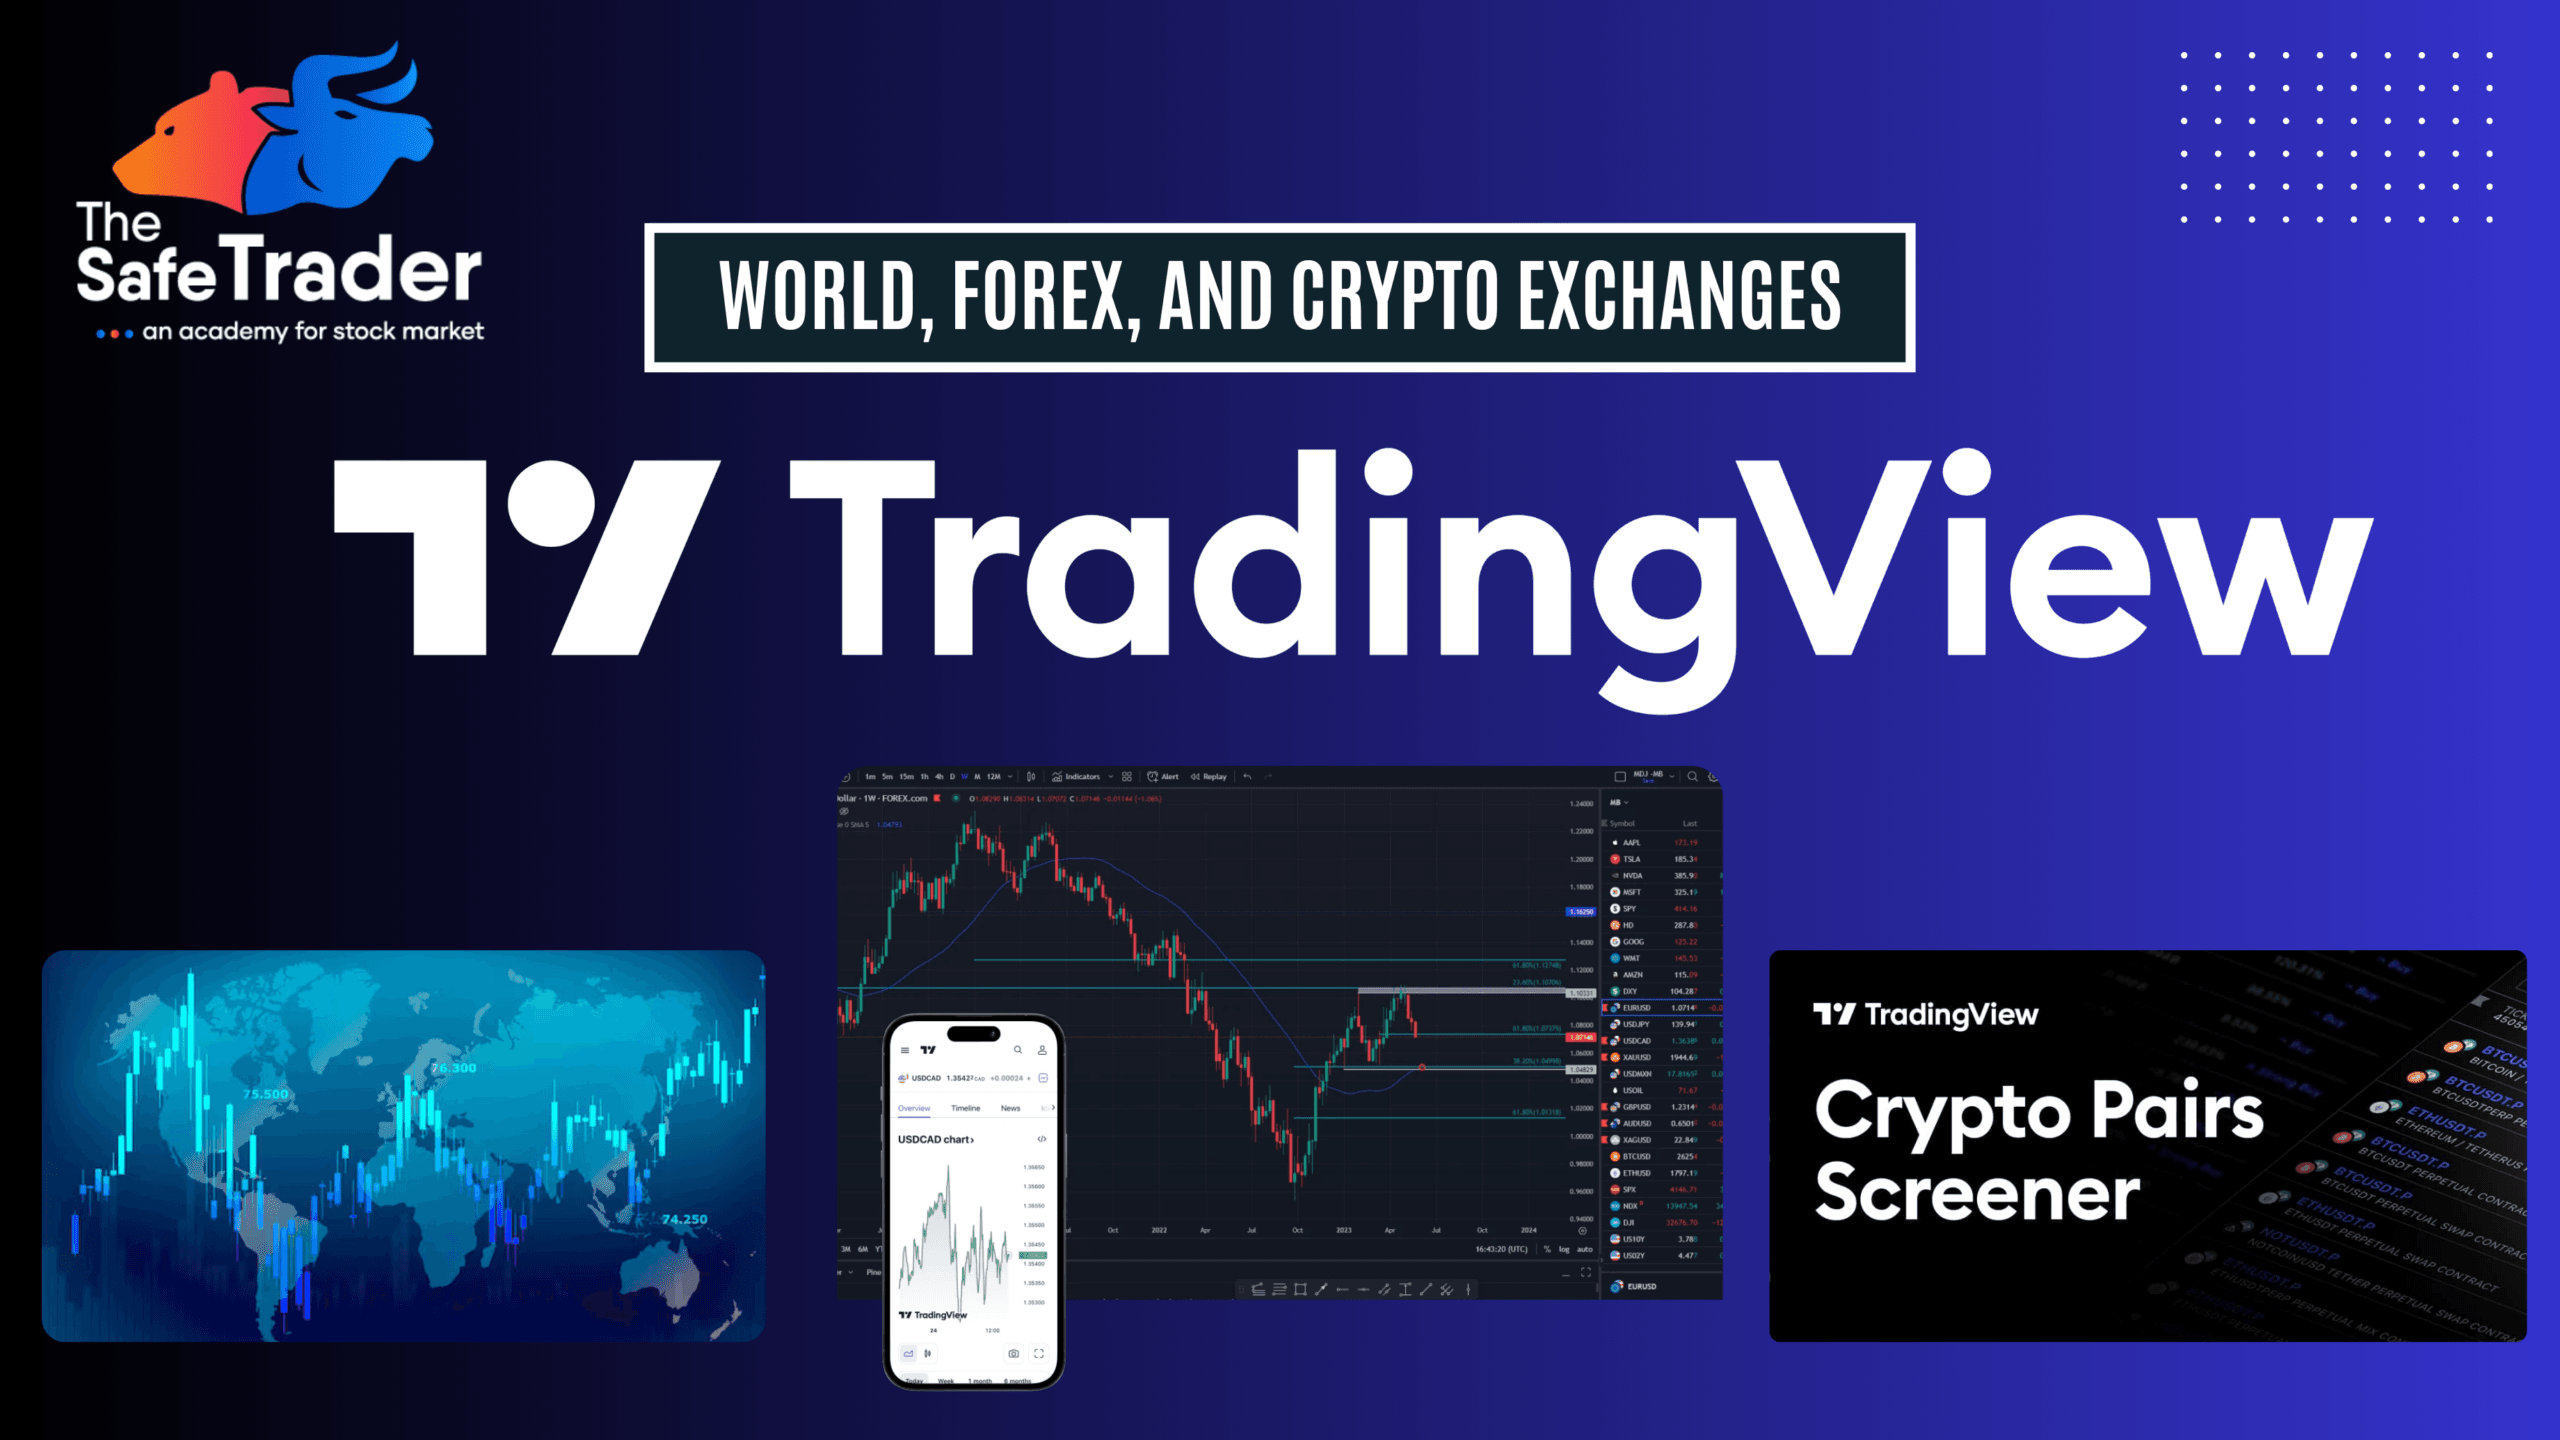
    World, Forex, and Crypto Exchanges

    Access to multiple exchanges, including world stock markets, forex, and cryptocurrency markets, allows traders to diversify their portfolios and explore opportunities across different asset classes.

    Economic Data and News Updates

    Staying informed about global economic events is crucial for traders. Platforms often provide real-time news feeds and economic data reports, ensuring that traders are aware of key events that may impact market prices.

    Community of Traders

    Engage with a community of traders to share strategies, ideas, and market insights. Many platforms offer forums or chat functions where traders can collaborate and learn from each other.

    Comprehensive Financial Analysis

    Comprehensive financial analysis tools provide detailed reports on stocks, including earnings, financial ratios, and debt levels, helping traders make well-informed decisions.

    Replay and Test

    Replay functionality allows traders to revisit past market conditions and test their strategies against historical data. This is an essential feature for traders looking to improve their performance over time.

    Advanced Layouts

    Advanced layout options allow traders to customize their workspace by arranging charts, trading panels, and research tools for maximum efficiency. 

    Web, Desktop, and Mobile Apps

    Trading on the go is easier with platforms offering web, desktop, and mobile applications. This ensures that traders never miss a market move, no matter where they are.

    Create Watchlists with Up to 1000 Stocks

    For traders who follow multiple markets or sectors, the ability to create and manage watchlists with up to 1000 stocks ensures that you’re always ready to act on potential opportunities.

    FAQs

    **1. Can I access these tools on mobile?**  

    Yes, most platforms offer mobile apps that come with all the essential trading tools.

    **2. Is paper trading available for all asset classes?**  

    Yes, paper trading is available for stocks, forex, and even crypto, depending on the platform.

    **3. What are the premium features?**  

    Premium features typically include advanced charting tools, institutional data, and access to additional research resources.

    Conclusion

    The modern trading platform is a comprehensive tool that caters to traders of all levels. From backtesting strategies to engaging with a community of traders, these platforms offer everything you need to make informed trading decisions across multiple markets. Whether you are looking to paper trade, analyze institutional data, or set real-time alerts, there’s a feature designed to enhance your trading experience.


  • SEBI Study: 93% of Individual Traders Face Losses in Equity F&O from FY22 to FY24, ₹1.8 Lakh Crore Aggregate Losses

    SEBI Study: 93% of Individual Traders Face Losses in Equity F&O from FY22 to FY24, ₹1.8 Lakh Crore Aggregate Losses

    A recent study by the Securities and Exchange Board of India (SEBI) has sent shockwaves through the trading community. The updated findings, released in September 2024, reveal that an overwhelming 93% of individual traders in the equity Futures and Options (F&O) segment suffered significant losses between FY22 and FY24. The aggregate losses for retail traders in this period have surpassed ₹1.8 lakh crores, raising critical questions about retail participation in high-risk financial instruments.

    The SEBI Study: Key Insights

    The SEBI study, a follow-up to earlier reports, presents a comprehensive analysis of the financial outcomes for individual traders in the F&O segment. The study highlights that only 7% of retail participants made any profit during the three-year period, and a vast majority encountered substantial losses. The study serves as a wake-up call for retail investors, regulators, and market participants alike.

    You can access the full SEBI report through this link.

    Key Findings from the Report

    • High Percentage of Losses: A staggering 93% of individual traders incurred losses during the study period. This trend is consistent with the notion that F&O trading involves higher risks, often unsuitable for inexperienced traders.
    • ₹1.8 Lakh Crores in Losses: The collective losses amount to ₹1.8 lakh crores over three years, underscoring the financial impact of speculative trading without adequate knowledge or risk management.
    • Skewed Profitability: While a small 7% of traders managed to generate profits, this suggests that only those with either professional expertise or a highly disciplined trading strategy could navigate the complexities of F&O trading successfully.
    • Retail Participation Growth: Despite the overwhelming losses, retail participation in the equity F&O segment continued to grow, spurred by the accessibility of online trading platforms and increased interest in the stock market during and after the pandemic years.

    Why Do So Many Retail Traders Incur Losses?

    UKRAINE – 2024/08/12: In this photo illustration, a Securities and Exchange Board of India (SEBI) logo is seen on a smartphone and a pc screen. (Photo Illustration by Pavlo Gonchar/SOPA Images/LightRocket via Getty Images)

    The SEBI study sheds light on several reasons why retail traders face such significant losses in the F&O market:

    • Lack of Knowledge: Trading in futures and options requires a deep understanding of market dynamics, price movement, and risk management, which many retail traders lack.
    • Emotional Trading: Many individuals engage in emotionally driven trading, reacting impulsively to market fluctuations without a well-thought-out strategy.
    • High Leverage: The lure of high leverage in F&O trading allows individuals to control larger positions with smaller capital, but it also amplifies losses when trades move in the wrong direction.
    • Short-term Speculation: Most retail traders approach F&O trading with a speculative mindset, focusing on short-term gains rather than long-term investment strategies. This often leads to rash decisions and quick losses.

    Key Findings from SEBI’s Study

    • High Loss Rates Among Individual Traders
      The study reveals that 93% of over 1 crore individual F&O traders incurred average losses of ₹2 lakh per trader (inclusive of transaction costs) between FY22 and FY24. Even more concerning, the top 3.5% of loss-makers—approximately 4 lakh traders—faced an average loss of ₹28 lakh per person over this period. This paints a sobering picture for retail investors, as only 1% of individual traders managed to earn profits exceeding ₹1 lakh after accounting for transaction costs.
    • Profits for Proprietary Traders and FPIs
      While individual traders suffered, proprietary traders and Foreign Portfolio Investors (FPIs) as a class enjoyed significant profits. In FY24 alone, proprietary traders and FPIs booked gross trading profits of ₹33,000 crore and ₹28,000 crore, respectively. This stark contrast highlights the disparity in performance between individual traders and larger entities, many of which leverage sophisticated algorithmic trading strategies. In fact, 97% of FPI profits and 96% of proprietary trader profits were generated through algorithmic trading.
    • The Burden of Transaction Costs
      One of the most significant barriers to profitability for individual traders is the high transaction costs. On average, individual traders spent ₹26,000 per person on F&O transaction costs in FY24. Over the three-year period, individuals collectively spent around ₹50,000 crore on transaction costs, with brokerage fees accounting for 51% and exchange fees making up 20% of these costs. The cumulative effect of these expenses further erodes the potential for profit.
    • Demographic Shifts: Younger and B30 City Traders
      The study also highlights a shift in the demographic makeup of F&O traders. The proportion of young traders (under 30 years of age) increased from 31% in FY23 to 43% in FY24, indicating a growing interest in high-risk trading among younger individuals. Additionally, 72% of individual F&O traders came from Beyond Top 30 (B30) cities, outpacing the proportion of mutual fund investors from these regions. This trend points to the growing participation of retail traders from smaller cities and towns.
    • Income Profiles and Persistence of Loss-Making Traders
      More than 75% of individual F&O traders in FY24 declared an annual income of less than ₹5 lakh, suggesting that many of these traders may not have the financial cushion to absorb significant losses. Despite enduring consecutive years of losses, over 75% of loss-making traders continued to participate in F&O trading. This persistence raises concerns about the understanding of risk and the influence of speculative behavior.

    Regulatory Implications and SEBI’s Role

    SEBI’s findings are likely to influence future regulatory frameworks in India’s equity markets, particularly around retail investor protection. The study brings to light the importance of financial literacy and responsible trading practices. SEBI has previously introduced initiatives aimed at educating traders about the risks involved in derivatives trading, but the new data suggests that further interventions may be necessary.

    SEBI’s ongoing efforts to promote investor education and financial literacy are critical, and the regulator is likely to take steps to mitigate the risks retail traders face in the F&O market.

    Steps to Minimize Losses in F&O Trading

    For retail traders looking to participate in the F&O market, adopting a disciplined approach and prioritizing risk management is essential. Here are a few recommendations for reducing trading risks:

    • Educate Yourself: Before diving into F&O trading, it’s crucial to understand how these financial instruments work. Familiarize yourself with market trends, technical analysis, and trading strategies.
    • Limit Leverage: While leverage can enhance gains, it can also magnify losses. Retail traders should use leverage cautiously and be aware of its risks.
    • Develop a Trading Plan: A well-structured trading plan can guide traders in executing trades based on analysis rather than emotions.
    • Diversify Strategies: Avoid putting all your eggs in one basket. Use a diversified trading approach, and never rely solely on F&O trading for financial gains.
    • Paper Trade: Many platforms offer simulated or paper trading, allowing individuals to test strategies without putting actual capital at risk.

    SEBI’s Regulatory Initiatives

    • Enhanced Disclosure Requirements: SEBI may enforce stricter disclosure norms for brokers to inform clients about the risks involved in F&O trading.
    • Eligibility Criteria: Introducing minimum net worth or experience requirements for individuals to participate in the F&O segment.
    • Investor Protection Programs: Launching initiatives aimed at educating investors about the risks associated with high-leverage trading.

    •  

    Conclusion

    Live Stock Market Training in Hyderabad

    The latest SEBI study serves as a stark reminder of the risks associated with equity F&O trading. While the allure of quick profits draws many retail traders to these high-risk markets, the harsh reality is that only a small fraction succeed. SEBI’s findings emphasize the importance of proper education, financial literacy, and risk management for individual traders to avoid falling into the 93% who incur losses.

    It is now more critical than ever for retail investors to approach F&O trading with caution, armed with knowledge, a disciplined strategy, and a strong focus on long-term financial health.

    For more information, read the complete SEBI press release here.

    Disclaimer: The information provided in this article is based on data available up to October 2023. For the most recent updates and detailed statistics, please refer to the official SEBI website or recent press releases.


  • SIP: Smart Investing for Future Growth

    Systematic Investment Plan (SIP) can help one build a sizeable retirement corpus with the help of constant investing in the long term. Though systematic withdrawal (SWP), one can withdraw that money in phases to secure monthly income.

    Systematic Investment Plan (SIP):

    • What is SIP? SIP is a disciplined investment approach where you invest a fixed amount regularly (usually monthly) in mutual funds. It allows you to benefit from rupee cost averaging and compounding over the long term.
    • How does it work? You choose a mutual fund scheme and invest a fixed amount (as low as ₹500) at regular intervals. The fund manager allocates your money to various assets (stocks, bonds, etc.).
    • Benefits of SIP:
      • Discipline: SIP encourages regular investing, helping you stay committed to your financial goals.
      • Rupee Cost Averaging: You buy more units when prices are low and fewer units when prices are high, averaging out the cost.
      • Power of Compounding: Over time, your investments grow exponentially due to compounding.
      • Flexibility: You can start, stop, or modify SIPs as per your convenience.
    • Taxation: SIPs are taxed based on the type of mutual fund (equity or debt) and the holding period.

    Systematic Withdrawal Plan (SWP):

    • What is SWP? SWP allows you to withdraw a fixed amount regularly from your mutual fund investment. It’s like creating your own pension or income stream.
    • How does it work? You specify the withdrawal frequency (monthly, quarterly, or annually) and the amount you want to withdraw. The fund manager sells units to fulfill your withdrawal request.
    • Benefits of SWP:
      • Regular Income: SWP provides a steady income, making it useful for retirees or anyone needing periodic cash flow.
      • Tax Efficiency: SWP withdrawals are considered Long-Term Capital Gains (LTCG) and taxed accordingly (10-30%).
      • Flexibility: You can adjust the withdrawal amount as needed.
    • Drawbacks: Exit loads (fees for early withdrawal) and potential market volatility.
    • Who can benefit? Not just retirees—SWP can help meet various financial needs (child’s education, EMIs, etc.).
    1.  

    SIP+SWP: SIP investment in a mutual fund can be an effective way to build a large retirement corpus in the long term. If picks mutual fund keeping in mind growth in the long term, reshuffle non-performing mutual funds on a constant basis, their investment can grow at a pace of 12 percent annually or above. On the other hand, if they don’t want to withdraw that amount in one go and want it in phases, they can start a systematic withdrawal plan (SWP), where they can get monthly income in the form of principal amount and return. In this write-up, know how Rs 15,000 monthly SIP can help one build over a Rs 1 crore corpus in 16 years, and after that, how they can withdraw Rs 70,000 monthly income from that for decades. 


    Disclaimer:

    https://thesafetrader.in/sebi-disclaimer/
    Our calculations are projections and are not investment advice. Do your own due diligence or consult an expert before investing.

    1/11

    What is SIP?

    SIP is a method of investing in mutual funds. It allows you to invest in a mutual fund scheme at a regular interval. You can choose a yearly, monthly, or daily SIP to invest in. You don’t need a large amount to invest through SIP. It starts with Rs 100, and most mutual funds have Rs 500 as the minimum SIP investment. Even if you invest a small amount for a long period of 15 years and above, the SIP investment can help you generate good returns. SIP works on the rupee cost averaging concept. The price of net asset value (NAV), the basic unit of a mutual fund scheme, keeps changing with the ups and downs of the market. So, you purchase NAV at different rates in different investment periods. It can help beat market volatility in the long run and maximize investments. 

    2/11

    What is SWP?

    What is SWP?

    It is opposite to SIP. Here, instead of investing at a prefixed interval, you withdraw money. The only difference is that you invest a lump sum amount in a mutual fund scheme to start SWP. The idea is you get growth on your investment, plus there is already the principal amount. So, one gets the mix of both in the form of a fixed income amount. If your rate of growth is higher than your rate of withdrawal, not only the SWP plan can help you get regular income, but also the value of your fund will grow. SWP is also based on rupee cost averaging basis. Here, the mutual fund house sells your NAV every withdrawal period. So, if the market is high and the cost of NAV is also high, the fund house will sell fewer NAVs for a prefixed amount. 

    3/11

    How to build over Rs 1 crore corpus in 15 years

    There can be many ways to build Rs 1 crore corpus, but we will set a target of 16 years. So, the idea is to invest a Rs 15,000 SIP for 16 years and get a 15 percent annualized return. In equity mutual funds, 12 percent annualized returns are not tough to get in the long run. But a good mix of mutual funds and reshuffling of non-performing mutual funds can help you generate returns of 15 percent. 

    4/11

    What will be your retirement corpus amount?

    What will be your retirement corpus amount?

    So, with that strategy, in 16 years, you can generate an estimated corpus of Rs 1,08,26,619 in 16 years, of which Rs 28,80,000 will be your investments and Rs 79,46,619 will be estimated long-term gains. 

    5/11

    What do you need to do?

    What do you need to do?

    You may invest that money in equity, hybrid, and debt funds. But since you need regular income on retirement and may not want to take risk with your money, you can pick a conservative hybrid, balanced hybrid, or a debt fund, where you get at least 8 percent annualized return.

    Facebook

    6/11

    How to get Rs 60,000 monthly income?

    How to get Rs 60,000 monthly income?

    As per SWP calculator, if you draw Rs 60,000 monthly income with Rs 1,08,26,619 and get 8 percent annualized return on your investments, then even after withdrawing the same pension for 40 years, or a total withdrawal of 2,88,00,000, you will have the balance worth of Rs 5,19,41,824. 

    7/11

    How to get Rs 60,000 monthly income? 

    It means, instead of Rs 60,000, you can go for a higher monthly income, or you can start with Rs 60,000 and increase the monthly income limit as inflation rises.

    8/11

    What if I withdraw Rs 70,000 a month? 

    What if I withdraw Rs 70,000 a month? 

    Given the same condition, if you withdraw Rs 70,000 a month, you can withdraw the amount for 40 years. 

    9/11

    What if I withdraw Rs 70,000 a month? 

    What if I withdraw Rs 70,000 a month? 

    After that period, your total withdrawal will be Rs 3,36,00,000, and the estimated balance worth will be Rs 1,67,99,011.

    10/11

    What if I withdraw Rs 75,000 a month? 

    What if I withdraw Rs 75,000 a month? 

    Even then, your investment can give you Rs 75,000 monthly income for 39 years, and the estimated balance amount after that will be Rs 1,54,732. 

    11/11

    What if I withdraw Rs 75,000 a month? 

    What if I withdraw Rs 75,000 a month? 

    The withdrawal amount after 40 years of Rs 75,000 monthly income for 39 years will be Rs 3,51,00,000.