Top Online Trading Academy For Beginners In 2025

Top Online Trading Academy for Beginners in 2025 Choosing the best online trading academy is the best course of action if you want to begin trading this year. Thousands of newcomers are joining the markets in 2025 with high objectives, but only those who receive the proper training, guidance, and approach end up being successful. This is where The Safe Trader Academy, the best trading academy in India, comes in; more than 5,000+ students nationwide trust it. Why Choose an Online Trading Academy in 2025 Although the world of trading is exciting, fast-paced, and full of opportunities, newcomers may find it overwhelming. For this reason, enrolling in a reputable online trading academy is essential. YouTube tutorials or free resources just cannot provide the structured learning, professional mentoring, and real-world exposure that it does. Every student at The Safe Trader Academy learns how to trade with confidence and consistency by combining theory, real-world market practice, and individualized coaching. Our group of experienced traders and mentors makes sure you learn how to be successful in trading, not just what it is. Comprehensive Stock Market Trading Courses for Beginners Here, stock market trading courses are designed especially for beginners who wish to learn about trading psychology and market behavior from the ground up. The courses make every concept easier to understand with real-world examples and live sessions, whether you want to learn about forex, futures, options, or equity trading. Here’s what you’ll learn inside our programs: Each course is designed to help you become an expert in both the technical and psychological aspects of trading, which is what separates long-term successful traders from those who are only learners. The Safe Trader – Best Online Stock Trading Courses in India The Safe Trader Academy’s commitment to hands-on learning is what sets us apart from other online stock trading courses in India. These features ensure that every student receives personal attention, hands-on training, and lifetime support – something you won’t find in other stock market courses in India. Best Trading Courses in India for Every Level There is no one-size-fits-all approach to learning at The Safe Trader. Both beginner and experienced traders who want to improve their skills can benefit from the best trading courses in India. The Safe Trader – India’s Best Trading Academy for Beginners The Safe Trader Academy is India’s most trusted stock market training academy. We are dedicated to helping beginners and professionals achieve financial freedom through trading. Led by Mr. Mallinath Mulage, our academy stands out because of: Join India’s Best Trading Institute Today Selecting the top trading academy in India requires consideration of value, mentorship, and actual success stories rather than just cost or reputation. At The Safe Trader, our results-oriented instruction transforms students into self-assured traders. Regardless of experience level, the Online Trading Academy equips you with the skills, knowledge, and confidence needed to succeed in the markets. Visit The Safe Trader Academy now. The Safe Trader Academy is the only place where training turns into success. Learn live, trade wisely, and develop your confidence.
Best Online Stock Trading Courses In India For 2025

Best Online Stock Trading Courses in India for 2025 You’re one step closer to taking control of your financial future if you’re searching for the best online stock trading courses in India. There are a lot of options available, so it’s critical to pick a trading academy that will enable you to trade with confidence in actual markets in addition to teaching theory. That’s exactly where The Safe Trader Academy stands out as one of the best online trading academies in India for 2025. Why The Safe Trader is India’s Top Online Trading Academy At The Safe Trader, we believe that with the right guidance, coaching, and approach, anyone can learn to trade successfully. Established in 2018, the academy is built by a team of highly skilled traders and educators who have years of hands-on experience in Forex, Equity, Futures, and Options trading. Over 5,000+ aspiring traders have been trained and are now confidently trading and building financial independence. The objective is straightforward: by offering the greatest trading courses in India &across the worlde, everyone will have access to professional-level stock trading education. Learn from India’s Leading Online Trading Academy Learning from qualified mentors can make all the difference in the confusing world of trading. Mr. Mallinath Mulage, a seasoned trader and Forex mentor with over 5 years of experience in both the Indian and international markets & 5 NISM certifications, is the CEO & Founder of The Safe Trader Academy. His mentorship approach guarantees that each student receives individualized attention by emphasizing discipline, strategy, and training. Under his guidance, The Safe Trader has become a leading online trading academy in India, known for its practical approach to teaching trading. In addition to learning how to trade, you will also learn why and when to trade, which is what makes successful traders different from others. What Makes Our Trading Courses the Best in India Results are more important than curriculum when choosing the best trading courses in India. Comprehensive online trading courses are available from The Safe Trader, which are designed to assist you in comprehending market trends, controlling risks, and making strategic trades. Here’s what makes our courses truly stand out: ✅ Tools & Software for Trading & Investing✅ Basics of Indian Share Market✅ Equity Investment✅ Fundamental & Technical Analysis✅ Futures & Options✅ Forex & Commodity Trading✅ Powerful Intraday Trading Strategies✅ Online & Offline Classes Available✅ Live Market Analysis & Handholding (3 Months)✅ 500+ Real-Time Market Assignments✅ One-on-One Interaction with Our Trainer & CEO✅ Zoom Recordings for Every Class✅ Intraday Setup for Indian and Forex Markets✅ Free Access to Upcoming Batches These features make The Safe Trader Academy one of the best online stock trading courses in India, ideal for beginner and experienced traders looking to improve their skills. Designed for Every Level of Trader Our online trading academy offers flexible learning options that can be adjusted to your pace, regardless of your level of experience. For Beginner: Utilize our “Introduction to Stock Market” and “Basic Technical Analysis” modules to establish a solid foundation. For Professionals: Make progress with our “Intraday Trading,” “Options Trading,” and “Forex Mastery” strategies. Every course is designed with an emphasis on practical application rather than merely theoretical knowledge, with an eye toward results. We guarantee that you become a trader, not just learn how to trade. Trusted by Thousands of Students Across India & Wordwide With locations all over India, The Safe Trader Academy is the most trusted name in stock market education. As more students share their success stories after finishing the top online trading courses in India, the alumni network keeps expanding. Students frequently mention how The Safe Trader’s individualized coaching and practical simulations enable them to trade consistently and confidently. Start Your Trading Journey Today The first and most crucial step in achieving financial independence is selecting the best trading academy. The Safe Trader Academy is more than just a learning environment; it’s a community designed to give you the attitude, abilities, and self-control you need to be successful in the stock market. So, now is the ideal moment to sign up for one of the top online stock trading courses in India if you’re prepared to make the change. Take charge of your financial future by learning from the professionals and putting real-time strategies into practice. 👉 Join The Safe Trader Academy today and turn the passion of trading into consistent success.
What Are Technical Indicators and Types?
One of the best methods for building your trading consistency and confidence when you’re initial starting out is to learn about technical indicators. At The Safe Trader Academy, we make the complex world of stock market technical indicators easy to understand so that all students, regardless of skill level, can become proficient in trend analysis, market timing, and making wise decisions. The foundation of any successful trader’s toolkit is technical indicators. Whether you’re into intraday, swing, or long-term trading, knowing what are technical indicators and how to use them effectively can transform your trading outcomes. What Are Technical Indicators? Technical indicators are, to put it simply, mathematical computations based on the price, volume, or open interest of stocks. They are used by traders to forecast future price movements, comprehend market behavior, and locate possible entry and exit points. Imagine having a roadmap that guides you through volatile markets – that’s exactly what technical indicators in the stock market do. They make price action easier to understand and draw attention to opportunities that might not be visible right away. For example, an RSI (Relative Strength Index) indicates whether a stock is overbought or oversold, while a moving average helps even out market swings. Technical trading is less emotional, more data-driven, and more structured thanks to these tools. Types of Technical Indicators There are several types of technical indicators, but most can be classified into 3 main categories – Where they are plotted, When do they indicate, What do they indicate. Each type has a distinct function that helps traders in developing deeper understanding of the market. 1. Where they are plotted Depending on where they appear on a chart, indicators are divided into two groups: 2. When do they indicate Two categories of indicators are distinguished by the times at which they indicate: Signals from lagging indicators come after a trend or reversal has begun. They are used to confirm trends or reversals and track price action. For instance, 3. What do they indicate 1. Trend Indicators To determine the strength and direction of a price movement, trend indicators are employed. They let you know if the market is trending sideways, upward, or downward. The following are a few of the best technical indicators for trading trends: Since they assist in identifying longer market movements and maximizing entry or exit timing, these are some of the best technical indicators for swing trading. 2. Momentum Indicators Momentum indicators track the speed at which prices move over a given period of time. Because they can predict trend reversals before they occur, they are frequently employed as leading technical indicators. Typical instances consist of: Among the best technical indicators for day trading are momentum indicators, which assist intraday traders in making prompt, well-supported decisions. 3. Volatility Indicators Volatility indicators quantify the degree of price volatility over a given time frame. They are crucial for spotting possible price consolidations or breakouts. Among the popular tools in this category are: Traders can prevent unanticipated price swings by using volatility tools with live intraday charts that include technical indicators. 4. Volume Indicators In order to validate signals and confirm trends, volume is essential. By examining the amount of trading activity that supports a move, volume-based technical indicators demonstrate its strength. Among the examples are: In order to validate market trends, volume indicators are crucial in both short-term and long-term trading setups. How to Choose the Best Technical Indicators for Stock Trading No one “perfect” indicator exists. Technical indicators that work well together are frequently used by profitable traders. Stronger confirmation signals, for example, can be obtained by combining a momentum indicator, such as RSI, with a trend indicator, such as the Moving Average. Whether you’re trading intraday, swing, or position, choosing the best combination of technical indicators depends on your trading goals and risk tolerance. With the help of live charts, market case studies, and real-time examples, The Safe Trader Academy’s best technical indicators for stock trading lessons and advanced training sessions show you how to use these tools efficiently. Why Learn Technical Indicators with The Safe Trader? The Safe Trader has empowered aspiring traders both in India and globally. Our training is based on the following and is led by Mr. Mallinath Mulage, an experienced mentor with over 5+ years experience & 5 NISM certifications, specializing in Forex, Futures, and Options trading. The Safe Trader is currently India’s leading stock market training institution. We are committed to helping beginners achieve their trading objectives, with a focus on: Start Learning the Best Technical Indicators Today The time to act is now if you’re prepared to advance your trading abilities. Unlock your full market potential by learning how to trade efficiently using the best technical indicators. 👉 Visit The Safe Trader Academy to enroll in our expert-led stock market courses today. Learn how to use technical indicators for swing trading, intraday trading, or long-term investing, and begin confidently making more informed, data-driven trades.
Benefits Of Taking Online Stock Market Classes

What Are The Benefits Of Taking Online Stock Market Classes? Enrolling in online stock market classes may be the best course of action for you if you’re keen to learn the craft of trading and investing but are unsure where to begin. From the comfort of your home, The Safe Trader Academy offers the best stock market course online to help you comprehend, evaluate, and make money from the financial markets. Learning to trade stocks has never been easier, more flexible, or less expensive in the modern digital world. Let’s examine the major benefits of taking online stock market classes and the reasons that thousands of Indian students rely on The Safe Trader to help them get started in trading. Learn Anytime, Anywhere Flexibility is one of the main benefits of taking online stock market courses. You are free to learn whenever and wherever you choose. Our online share market course enables you to manage your education and everyday responsibilities, regardless of whether you’re a student, working professional, or aspiring trader. You can learn at your own pace with The Safe Trader Academy’s real-time practice modules, recorded lectures, and interactive sessions – without compromising on quality. Because of this, our platform is one of the best online stock market courses in India & worldwide for students of all skill levels. Guidance from Expert Mentors Your trading journey can be completely changed by a great mentor. Industry expert Mr. Mallinath Mulage, a certified mentor with more than five years of experience and 5 NISM certifications, is the instructor for our stock market trading courses online at The Safe Trader Academy. He has personally guided more than 5,000+ students to explore the fundamentals of forex trading, options, futures, and technical and fundamental analysis. You will receive individualized mentoring and practical insights to assist you in making well-informed trading decisions through our share market online courses. Practical, Real-World Learning Many beginners struggle because traditional education doesn’t teach the practical side of the market. Our online stock market classes focus on real-world application, not just theory. You’ll gain knowledge of risk management, chart analysis, market trend interpretation, and profitable trading techniques. With the help of live market presentations and practice sessions, our online stock market courses ensure that every idea you learn can be used right away in real-world trading scenarios. You can develop market-ready skills with The Safe Trader Academy, enabling you to trade with confidence from day one. Affordable and Accessible Education Online share market courses, on the other hand, provide excellent instruction at a significantly lower price. The Safe Trader Academy is dedicated to ensuring that everyone who aspires to financial independence can afford and obtain financial education. Our best online stock market courses are affordable without giving up learning experience, content depth, or mentorship, making them the perfect option for beginners and professionals both. Build Long-Term Confidence and Skill Building a long-term mindset is more important than focusing only on making quick money when taking an online stock market course. Every successful trader needs to have analytical thinking, emotional control, and discipline, all of which you will acquire. The stock market trading courses online offered by The Safe Trader Academy are designed to strengthen your foundation and provide you the ability to make wise investment choices on your own. In addition to learning how to trade, you will also learn why trades are successful and how to adjust to shifting market conditions. Why Choose The Safe Trader Academy? The Safe Trader Academy is one of India’s most trusted trading academies, known for turning beginners into confident, successful traders. The Safe Trader Academy was founded by Mr. Mallinath Mulage and offers a comprehensive trading education experience by combining individualized mentoring, advanced training, and hands-on learning. Here’s what makes us stand out: Start Learning with The Safe Trader Academy Today It’s time to move forward if you’re serious about securing your financial future. Enroll in The Safe Trader Academy online stock market courses to gain confidence in your ability to analyze, invest, and increase your wealth. Anyone who wants to trade wisely, reduce risks, and create a steady stream of income from the markets should take our online share market course. 👉 Visit The Safe Trader Academy to begin your path to financial independence right now by signing up for the best online stock market course.
Best Algorithmic Trading Courses
Top Algorithmic Trading Courses Enrolling in an algorithmic trading course could be your first step toward becoming an expert in the current markets if you’ve ever wondered how professionals make data-driven decisions in milliseconds. One of the best algorithmic trading courses in India is available from The Safe Trader Academy. It is designed to help you automate trades, reduce emotional biases, and increase consistency by utilizing smart technology and tried-and-true systems. What Is Algorithmic Trading? Let’s first clarify what algorithmic trading is before you get started. In simple terms, it is the process of automatically executing trades using mathematical models and computer programs. These programs enable traders to enter or exit positions at the ideal moment by adhering to predetermined rules based on indicators, price movements, and market conditions. For beginners as well as professionals, The Safe Trader’s algorithmic trading courses reduce these complex structures to simple, useful knowledge. You’ll discover how using algorithms can improve your trading strategy and provide you with a competitive advantage over manual traders. Why Learn Algorithmic Trading? Now that market volatility is at its highest, learning algorithmic trading becomes essential rather than optional. Nowadays, the financial industry depends heavily on automation, and traders who possess an understanding of algorithms are able to spot opportunities more quickly and make more intelligent trades. You can learn how to integrate technology, data, and strategy to build a reliable and successful trading system by enrolling in The Safe Trader’s algorithmic trading course online. Our best algorithmic trading courses prepare you for real-world trading, where timing and accuracy are crucial, whether you want to trade forex, commodities, or stocks. What You’ll Learn The top algorithmic trading courses offered by The Safe Trader Academy are made to translate theory into useful skills. When you enroll, you will receive the following benefits: From an interested beginner to an experienced trader, we want every student to leave with the self-assurance necessary to create and implement algorithmic trading strategies on their own. Why Choose The Safe Trader Academy? Choosing the appropriate platform for your algorithmic trading course can have a significant impact. At The Safe Trader Academy, we don’t just teach concepts – we build traders. Our academy has trained over 5,000+ students in India as well as worldwide under the direction of Mr. Mallinath Mulage, a certified mentor with over 5+ years of experience and 5 NISM certifications. What makes us special is this: You’re developing a long-term trading career with The Safe Trader Academy, not just learning. Who Can Join This Course? The algorithmic trading courses offered by The Safe Trader Academy are perfect for: To begin, you don’t have to know how to program. Our step-by-step approach makes even the most technical topics easy to grasp. Take the Next Step with The Safe Trader Academy You can access structured learning, professional mentoring, and practical application by signing up for The Safe Trader Academy’s best algorithmic trading courses in India & worldwide. Make your trading journey data-driven, disciplined, and digitally intelligent to avoid uncertainty. 👉 Enroll now and start mastering the art of algorithmic trading with The Safe Trader Academy!
Best Scalping Trading Courses
Top Scalping Trading Courses Enrolling in a scalping trading course might be the best course of action for you if you desire to earn from the stock market in a timely manner. One of the most exciting and goal-oriented trading strategies is scalping, which is ideal for traders who value making decisions quickly and seeing steady daily gains. We provide the best scalping trading courses in India at The Safe Trader Academy, designed to help you become proficient in quick trading setups, high-probability strategies, and effective execution methods. What Is Scalping Trading It’s essential that you understand what scalping means before starting a scalping trading course. Scalping is a short-term trading technique in which traders profit from minute-by-minute price fluctuations. Making several small profits throughout the day that can add up to a significant amount is the aim rather than waiting for large price swings. Enrolling in our scalping trading courses will teach you how to: Our top scalping trading courses are the best choice if you’ve ever wanted to understand how successful day traders generate revenue despite volatile markets. Why Choose The Safe Trader for the Best Scalping Trading Courses At The Safe Trader Academy, we are aware that scalping requires both speed and accuracy. Our best scalping trading courses are designed to simplify complex trading concepts into actionable strategies. We offer a customized learning experience that guarantees you completely understand the market, regardless of your level of experience. What sets our scalping trading courses online and offline apart is this: In addition to teaching trading, our goal is to develop self-assured, self-sufficient traders who are successful in any market environment. Learn from the Best Scalping Trading Courses Online Can’t attend classes in person? No issue. You can learn from anywhere at any time with the help of The Safe Trader’s scalping trading courses online. Similar to our offline programs, these online sessions offer in-depth instruction and practical experience. Our online course on scalping trading will provide you with: Our students enjoy how simple and useful these scalping trading courses online are, enabling them to trade successfully and with confidence from the comfort of their homes. What You’ll Learn in the Scalping Trading Course You are going to learn a thorough understanding of quick-paced trading strategies that function in actual market situations when you enroll in The Safe Trader’s scalping trading course. Here is an overview of the topics covered: For those who wish to trade like pros, this makes our program one of the best scalping trading courses in India. Why Scalping Trading Is Perfect for You Scalping is best suited for traders who wish to: Through our scalping trading courses, you will acquire the skills and mindset necessary to seize opportunities quickly. Those who enjoy action, accuracy, and speedy outcomes – without spending their days glued to a screen – will benefit most from this approach. Build Your Trading Career with The Safe Trader The Safe Trader Academy has already trained over 5,000+ students worldwide, which uses intelligent trading to help them become financially independent. Whether you want to trade full-time or as an extra revenue stream, our top scalping trading courses equip you with the skills and self-assurance you need to be successful. Learning a trading lifestyle is just as important as learning strategies. You will be prepared to enter the markets with assurance and consistency if you receive mentorship, live practice, and organized modules. Enroll in the Best Scalping Trading Courses Today Now is the time to act if you’re serious about becoming an expert at quick trades and creating a steady source of income. Get access to the best scalping trading courses designed for success in the real world by enrolling in The Safe Trader Academy. Visit The Safe Trader Academy to learn more about our scalping trading courses today. Develop your market timing skills, learn tried-and-true intraday setups, and launch your lucrative trading career right now!
Best Swing Trading Courses
Top Swing Trading Courses Taking a swing trading course is the best course of action if you’re searching for a successful yet flexible method of trading the markets. By avoiding the stress of intraday trading, swing trading enables you to benefit from short- to medium-term price movements. The best swing trading courses in India are offered by The Safe Trader Academy, which aims to teach beginners as well as experts effective trading methods. Why Choose Swing Trading Courses? “Why should I learn swing trading?” is a question that many traders have. The answer is simple: swing trading provides a balance. You may gain from both upward and downward market movements without spending your entire day in front of a screen. Taking swing trading courses will teach you: You can create an effective trading schedule that works for you by enrolling in the appropriate swing trading course online and offline. Best Swing Trading Courses in India for Beginners Selecting the best swing trading courses in India is the first step if you’re new to trading. Our programs at The Safe Trader Academy are made to make ideas easy for beginners to understand and apply. Our courses for beginners include: Because of this, we are regarded as one of the top swing trading course providers by thousands of students nationwide. Features of the Best Swing Trading Courses Not all courses are made equal. The best swing trading courses combine proven strategies, professional mentoring, and hands-on training. Our programs at The Safe Trader Academy are unique due to: Because of this, our program is the best swing trading course available online & offline for anyone looking to achieve success. Swing Trading Course Online – Learn Anytime, Anywhere Our swing trading course online & offline is the best option for students and working professionals. You can learn at your own pace from any location in the world with interactive live sessions, Q&A sessions, and recording access. Taking a swing trading course online & offline with The Safe Trader Academy provides you with: Our swing trading courses online & offline provide you with all the tools you need to be successful, regardless of your level of experience. What You’ll Learn in Our Swing Trading Course Our swing trading course is carefully designed to make sure that you gain the skills and self-assurance necessary to trade. You will discover: You will have a thorough understanding of how to identify successful setups and confidently handle trades by the program’s conclusion. For this is why we are regarded as one of the best swing trading courses available in India to serious learners. Enroll in the Best Swing Trading Courses Today Swing trading provides steady profit opportunities, flexibility, and reduced stress. However, success requires the right instruction and direction. Visit The Safe Trader Academy to learn more about our swing trading courses today. Take the first step toward successful trading with confidence by enrolling in the best swing trading course online & offline available right now.
Best Futures Trading Courses

Top Futures Trading Courses Taking a futures trading course is the ideal first step if you want to learn how to use leverage in the stock market and accumulate long-term wealth. Through the use of advanced techniques that, when properly implemented, can yield steady revenue, futures trading enables you to speculate on changes in the prices of stocks, indexes, and commodities. Some of the best futures trading courses in India are offered by The Safe Trader Academy, catering to beginners as well as professionals who wish to trade more confidently and effectively. Why Choose Futures Trading Courses? “Why should I learn futures trading?” is a question that many traders have. The answer is straightforward: futures markets provide great chances for speculating and hedging and are very liquid and adaptable. Enrolling in futures trading courses will teach you: You can distinguish yourself from casual traders by avoiding common blunders and developing disciplined strategies with the correct futures trading course online (or) offline. Best Futures Trading Courses for Beginners The safest way to get started in the stock market is by selecting the best futures trading courses. The Safe Trader offers beginner-friendly modules such as: Because of this, thousands of students who are searching for the best futures trading courses in India put their trust in us. Features of the Best Futures Trading Courses Not all programs deliver results. The best futures trading courses are identified by their emphasis on hands-on instruction and knowledgeable mentoring. You receive the following at The Safe Trader: Because of this, our program is regarded as one of the best futures trading courses online and offline in India. Futures Trading Course Online – Learn Anytime, Anywhere Flexibility is important for students and working professionals. For this reason, The Safe Trader provides futures trading courses online & offline that include interactive sessions, study materials that are accessible for life, and mentor support. Our best futures trading courses online & offline will provide you with the following features: You can begin your journey with our online futures trading courses right now, regardless of where you are in India or overseas. What You’ll Learn in a Futures Trading Course The objective of our futures trading course is to equip you with all the necessary skills to trade successfully. What you will cover is as follows: Enroll in the Best Futures Trading Courses Today Although trading futures is a great way to increase revenue, it can also be risky if you are not properly trained. Don’t let luck determine your success. Enroll in a structured learning program. Visit The Safe Trader Academy now to learn more about our futures trading courses today. Start trading futures with clarity, discipline, and confidence by enrolling in the best futures trading courses in India right now.
Best Intraday Trading Courses
Top Intraday Trading Courses The best place to start if you want to be successful in the stock market is by taking intraday trading courses. Buying and selling stocks within the same trading day in order to capitalize from short-term price movements is known as intraday trading, or day trading. For beginners and aspiring traders who wish to confidently navigate fast-paced markets, The Safe Trader Academy offers the best intraday trading courses in India. Why Choose Intraday Trading Courses? The stock market is fast-paced, and beginners frequently find it difficult to generate consistent revenue without the proper information. The methods, strategies, and tools required to time the market, analyze stocks, and lower risks are provided by a day trading course. By enrolling in an intraday trading course online (or) offline, you’ll learn how to: Our courses at The Safe Trader Academy cover more than just theory. Applying actual strategies in both simulated and real-world market scenarios will help you become a more intelligent trader. Best Intraday Trading Course for Beginners “Which is the best intraday trading course for beginners?” is a question you may have if you’re new to trading. Selecting a course that strikes a balance between theory and practice is the solution. Our beginner-friendly modules at The Safe Trader Academy consist of: Because of this, students from all over India trust us to provide them with the best intraday trading courses available. Features of the Best Intraday Trading Course Your trading career can be shaped by the appropriate training program. This is what makes our program as the best intraday trading course: It is understandable why traders nationwide think of us as the best intraday trading course online (or) offline. Intraday Trading Course Online – Learn Anytime, Anywhere Time or place limitations shouldn’t be an excuse for learning to stop. Because of this, you can learn from anywhere in the world with our intraday trading course online. You can easily fit trading education into your schedule with the help of interactive live sessions, recordings, study guides, and mentor support. Our online intraday trading courses are flexible and beneficial for anyone, whether they are a student, working professional, or hoping to become a full-time trader. Do you prefer learning offline? No worries, there are offline classes available as well. To allow for your preferred method of learning, both online and offline options are available. What You’ll Learn in Our Day Trading Course Everything you need to get started and be successful is covered in our day trading course. Important areas of learning consist of: You will have total clarity and confidence in your ability to trade intraday markets by the end of our program. Why Learn with The Safe Trader Academy? We are more than just another training center here at The Safe Trader Academy. We are the most reputable stock market institute in India. Thousands of students pick us for their intraday trading courses for the following reasons: The Safe Trader Academy is an excellent resource if you’re searching for the best intraday trading courses available in India. Enroll in the Best Intraday Trading Courses Today Exciting opportunities can be found in intraday trading, but only with the right training. Don’t use guesswork to risk your hard-earned money. Rather, enroll in an organized learning program created by professionals. Visit The Safe Trader Academy now and look into our courses on intraday trading. Start trading with confidence right now by enrolling in the best intraday trading course available!
Silver Hits Record High of ₹1.4 Lakh/kg – What’s Next?
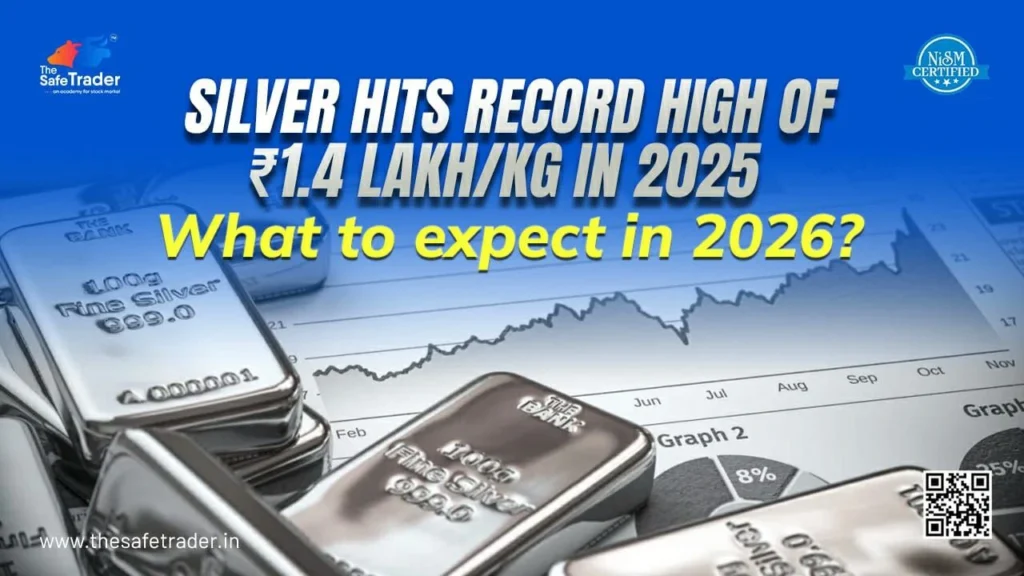
Silver Tops Record in 2025 This year, silver-often referred to as the “poor man’s gold”- has gained attention in the Indian market. In the domestic market, silver prices hit a record high of ₹1.4 lakh per kilogram on Thursday, representing a startling 59% increase so far this year in 2025. Both traders and long-term investors are finding silver to be an increasingly alluring investment option as a result of this surge, which is a reflection of both domestic and international market trends. What Drives Silver Prices? For more than three years, the silver market has been rising, but 2025 has been especially notable. Global prices surpassed the $45/ounce mark, which hasn’t been reached in over 14 years. This rally has been influenced by a number of factors: Weak Rupee: The cost of imported silver has increased due to the Indian rupee’s depreciation against the US dollar, which has a direct impact on domestic prices. As silver prices rise globally, investors in India have seen higher returns in local currency terms, with the rupee at 88.69/$. Industrial Demand: Silver has a wide range of industrial uses in addition to being a precious metal. Silver prices have increased due to growing industrial demand for everything from solar panels and electronics to medical equipment. According to analysts, the current rally has been sustained by the convergence of several industrial tailwinds. Safe-Haven Investment: Investors are increasingly searching for safe-haven assets due to global uncertainties, such as inflation worries and geopolitical tensions. Similar to gold, silver offers protection from fluctuations in the economy. Investor confidence in silver as a long-term store of value is demonstrated by the 59% year-to-date gain. Comparison with Other Assets The performance of silver has exceeded that of major equity indices as well as gold. As of this week: In the meantime, the Indian rupee lost 3.5% of its value in relation to the US dollar. The fact that precious metals, especially silver, have outperformed traditional equity markets this year is highlighted by this comparison. Gold Market Trends India’s traditional safe-haven asset, gold, has also seen a multi-year upswing. Although intra-day trading levels were marginally lower, domestic market prices for December delivery on MCX reached ₹1.14 lakh per 10 grams. This softening, according to market analysts, is the result of both short-term domestic factors and global trends. Gold remains a vital part of investment portfolios, particularly for conservative investors, notwithstanding this slight volatility. What This Means for Indian Investors The silver rally offers both possibilities and difficulties for individual investors. Here are some important lessons learned: Conclusion Silver’s rising significance as a commodity and a hedge against market volatility is highlighted by its record-breaking price of ₹1.4 lakh/kg in India. The rally demonstrates how global variables that affect precious metal prices include currency fluctuations, industrial demand, and safe-haven sentiment. Analysts predict that the price of silver will continue to be influenced by major factors in 2026, including global inflation trends, demand from sectors like electronics and renewable energy, and the rupee’s value in relation to the US dollar. While some expect the bullish trend to extend, others caution about possible phases of consolidation if global markets stabilize. Analysts predict that the demand from the electronics and renewable energy sectors, the rupee-dollar exchange rate, and worldwide inflation will all influence silver prices in 2026. Some predict potential consolidation, while others anticipate further gains. Because of its significance in international trade and wider economic trends, silver continues to be a major player in the precious metals market. For the latest market updates and insights, follow The Safe Trader Academy. Disclaimer:The information provided here is purely for educational and informational purposes only and reflects our personal analysis and opinions. We are not SEBI-registered advisors. Please consult a qualified financial advisor before making any investment decisions.