
Thesafetrader

Author: thesafetrader.in

  • Bank Nifty Hits Record High: ₹57,049.50

    Bank Nifty Hits Record High: ₹57,049.50

    Bank Nifty Hits Record High

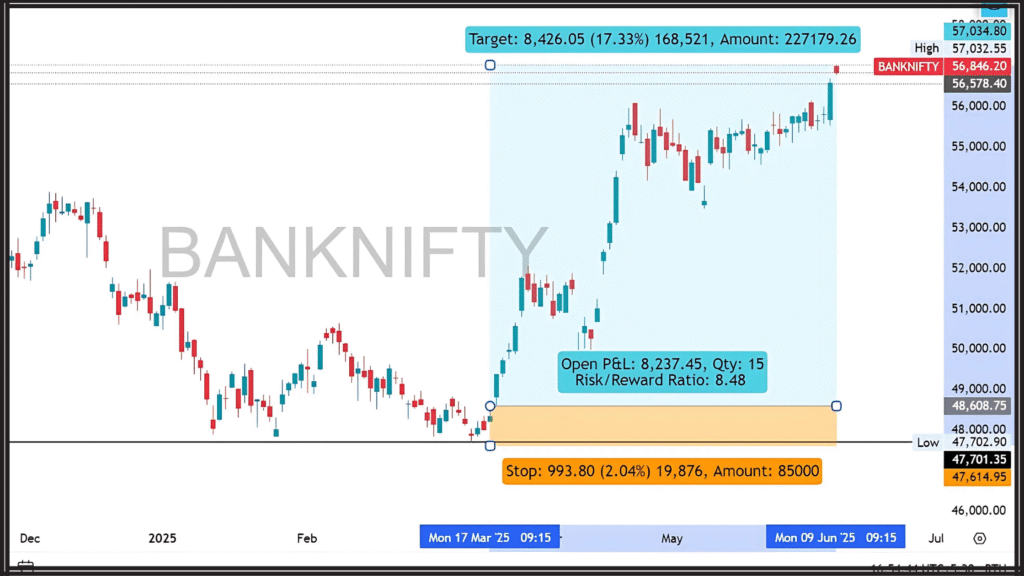
    The Bank Nifty Index, India’s benchmark banking sector index, made headlines today by surging to a new all-time high of ₹57,049.50, supported by strong policy action from the Reserve Bank of India (RBI) and a sharp rebound in banking stocks. This milestone marks a significant shift in market sentiment, especially for financials that have been lagging behind tech and FMCG sectors over the past year.

    Let’s break down what led to this breakout, what it means for market participants, and how you can position yourself accordingly.
    Bank Nifty

    RBI’s Liquidity Push: The Catalyst Behind the Rally

    The RBI’s recent surprise moves have played a central role:

    • Repo Rate Cut by 50 bps: The repo rate was cut to 5.5% with the intention of suiting credit growth and economic activity. It is the clearest pivot the central bank has displayed-from the earlier hawkish to now accommodative. 
    • CRR Cut by 100 bps: The Cash reserve ratio was down by 100 bps, flooding the Indian banking system with almost ₹2.5 lakh crore. This has improved liquidity and let banks lend more aggressively and at much lower costs. 

    Liquidity-enhancing measures through these twin policy tools are the RBI’s way to provide some short-term stimulus to growth while continuing to invest in inflation control measures in the long run.

    Sector-Wise Breakdown: Bank Stocks on Fire

    Here’s how key banking players moved in today’s session:

    Bank NamePrice ChangeReason for Movement
    Kotak Mahindra+2.1%Strong credit growth forecast, lower CoF
    Canara Bank+2.7%PSU banking rally + robust NIM projections
    Axis Bank+1.9%Attracted fresh FII inflows
    PNB+3.4%Mid-cap PSU favorite, under-ownership lifted
    AU Small Finance+2.3%Benefit from micro-loan demand surge
    ICICI Bank-0.2%Slight correction after recent rally

    Technical Analysis: Breakout or Bull Trap?

    • Previous Resistance Broken: Bank Nifty had faced an intense resistance around ₹56,800–₹57,000. Clean highs with high volume above these Vogue Prices are a validation of bullish momentum.
    • Indicators: An RSI crossing of 70 is an overbought sign-but during vigorous upward moves, the RSI can remain high.
    • Next Target: Fibonacci extension suggests near-term upside pressure at ₹58,300–₹58,500.
    • Support Zones: Immediate support rests around at ₹56,600. A breach of this level may invite selling pressure on profits.

    👉 Pro tip to traders: A trailing stop-loss can be placed below support to ride the momentum while protecting profits.

    Market Sentiment & Institutional Support

    🔍 FII & DII Action:

    • Foreign Institutional Investors (FIIs) have turned to net buying of Indian equities for the last three trading sessions, putting in over ₹6,000 crore, especially for BFSI stocks.
    • Domestic institutional investors (DIIs) also continued buying PSU banks like Bank of Baroda, SBI, and Canara Bank, signaling domestic confidence in economic resilience.

    🧭 Sentiment Drivers:

    • Easing inflation and GDP growth of 6.8% YoY (from the latest Q4 FY25 data) have set the macro tones behind a bullish risk appetite led by banking.
    • With the rise in credit demand from MSMEs and recovery in corporate capex, investors feel more optimistic.

    A Quick Flashback: Bank Nifty’s Journey

    YearBank Nifty Approx LevelKey Events
    2020~20,000COVID-19 crash
    2021~36,000Economic recovery begins
    2022~41,000High inflation, rising interest rates
    2023~44,000Banking earnings strengthen
    2024~51,000Pre-election rally
    2025₹57,049.50Record high post-election + RBI policy support

    Macro Trends Supporting the Rally

    1. Asset Quality Improvement: NPAs have been coming down on a consistent basis, thus strengthening the balance sheets.
    2. Stable Inflation: CPI inflation remains within the RBI’s target band, thus supporting flexibility to the central bank.
    3. Corporate Credit Cycle: Higher demand from MSMEs, infrastructure projects, and rural lending would have a silver lining of loan book growth.
    4. Global Liquidity: FIIs have been net buyers in India, with a large chunk of investments going into financials due to elevated risk-reward trade-offs.

    What This Means for Stakeholders

    ✅ For Traders:

    • Short-term trend-following times are ideal. 
    • Look for breakout trades in medium-sized private banks or selected PSU banks. 
    • Use intraday and swing-trading opportunities with high-beta bank stocks. 

    ✅ For Long-Term Investors:

    • This ATH confirms strength in Indian banking.
    • Focus on banks with digital lending capability, healthy CASA ratios, and good provisioning. 

    ✅ For Portfolio Managers:

    • Overweight banking sector stocks, which may outperform Nifty50 over the forthcoming 2 to 3 quarters.
    • Remain diversified within financials: NBFCs, private banks, and PSU recovery plays.

     Conclusion: The Bull Is Back in Banking

    The all-time high of ₹57,049.50 isn’t just a number — it signals that India’s banking system is entering a new growth phase, backed by:

    • Pro-business central bank policies
    • Robust credit growth
    • Improving asset quality
    • Renewed investor interest post elections

    With macroeconomic conditions favouring a pro-liquidity environment, the banking sector may continue to outperform — potentially leading the broader market rally for the rest of 2025.

    FAQs

    Q1. Why did Bank Nifty hit an all-time high today?
    ➡ Due to the RBI’s surprise repo rate and CRR cuts, improving liquidity, reducing bank funding costs, and triggering a buying spree in banking stocks.

    Q2. What is the next target for Bank Nifty?
    ➡ Technically, ₹58,500 is the next resistance. Above that, ₹60,000 is possible in the coming weeks if the uptrend holds.

    Q3. Is this a good time to invest in banking stocks?
    ➡ For long-term investors: yes, selectively. Look for banks with solid fundamentals and good digital transformation metrics.

    Q4. What risks could pull Bank Nifty down?
    ➡ Global uncertainty, unexpected inflation spikes, or RBI tightening in future if inflation flares up again.

    Q5. Which banks are top picks post this breakout?
    ➡ ICICI Bank, HDFC Bank, Canara Bank, Kotak Mahindra, and AU Small Finance Bank.

    👉 Join The Safe Trader Academy today and start trading like a pro.

    Join our free telegram channel
  • Stock Market Analysis for Beginners

    Stock Market Analysis for Beginners

    STOCK MARKET ANALYSIS

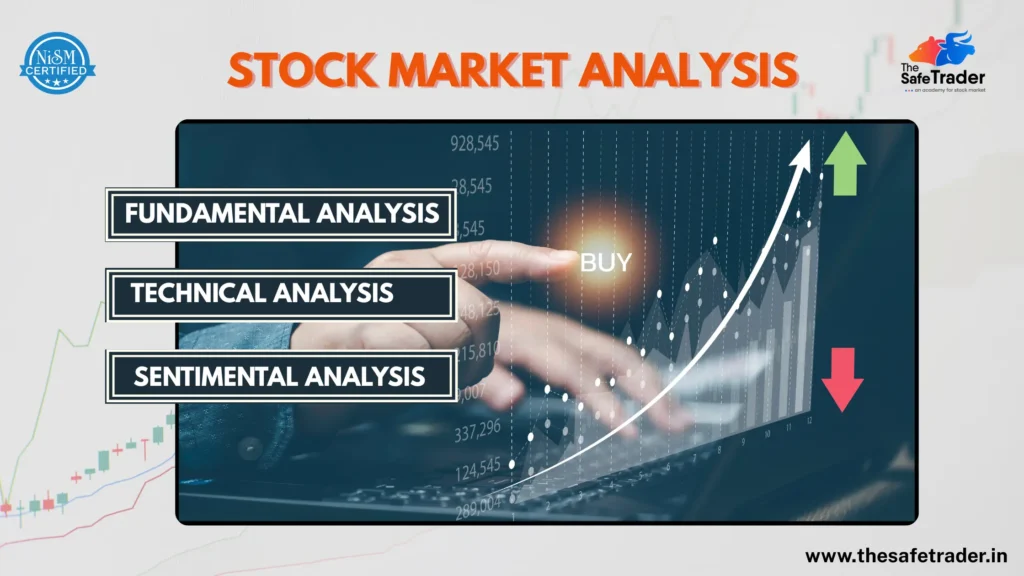
    The stock market is a complex and dynamic system influenced by multiple factors. To succeed in it, traders and investors must understand how to analyze stocks from various perspectives. Traditionally, there are three main types of analysis used in the stock market:

    1. Fundamental Analysis
    2. Technical Analysis
    3. Sentimental Analysis

    Each plays a different role in your decision-making process. Some market experts, like Mallinath Mulage ,CEO of The Safe Trader Academy Hyderabad, believe that while all three are essential, their weight and importance vary depending on the trading style. According to him:

    • Fundamental Analysis: 10% importance
    • Technical Analysis: 90% importance

    1. Fundamental Analysis: Laying the Foundation

    Fundamental analysis focuses on evaluating the intrinsic value of a company. It answers the question:

    “Is this a good business to invest in?”

    This would help long-term investors who are not concerned about daily price movements but are concerned about whether the company is financially sound and will be able to grow in the long run.

    What Does It Include?

    • Earnings & Revenue Growth: Is the company consistently making profits?
    • P/E Ratio: Is the stock overpriced or undervalued?
    • Debt vs. Assets: Is the company financially sound?
    • Management Quality: Who runs the company?
    • Investor Types: Mutual funds, FIIs, promoters investing?
    • Dividend Yields: Are shareholders being rewarded?

    Example:

    Suppose, for instance, you are evaluating ITC Ltd. Through fundamental analysis, 

    • you will find out the kind of profits the company is making.
    • Whether the company is overvalued or undervalued.
    • What future prospects might be in terms of business expansion or sector growth.

    “Fundamentals help you select the right stock, but they won’t tell you the right time to buy it.”

     Tip: Use fundamentals to shortlist strong companies in booming sectors like banking, IT, or energy before digging into technical charts.

    2. Technical Analysis: Timing the Market

    Once you’ve got a fundamentally sound stock, the question is—when to buy it and when to let go of it? That’s where Technical Analysis comes in.

    Technical analysis considers price action, volume, and market patterns to decide the best entry price or the best time to exit a trade. 

    According to Mallinath Mulage, 90% of the stock market decisions are pegged on technicals, especially in the case of traders and short-term investors.

    What Does It Focus On?

    • Price Trends: Is the stock in an uptrend or downtrend?
    • Volume: Are the buyers stronger or the sellers?
    • Indicators: RSI, MACD, Bollinger Bands, Fibonacci
    • Chart Patterns: Flags, Wedges, Double Tops, Head & Shoulders
    • Support & Resistance: Levels for entry/exit
    • Buyer-Seller Sentiment: Grasping the market psychology

    Technical analysis reads in the minds of the market. It does not care about a company’s profits- it cares about what the market thinks will happen next.

    Example:

    Say you have identified Reliance Industries as a fundamentally strong stock. Should you buy it today, next week, or wait for a cheaper price? Technical analysis will help you determine:

    • Where is the price currently sitting?
    • Is it currently on an uptrend or is it in a pullback?
    • Is the momentum amongst the buyers really strong?

    “An excellent stock could still make you lose money if your timing is wrong.”

     Tip: Always trade with the trend; minimize your risk by trading close to S/R zones and moving averages for better profit realization.

    3. Sentimental Analysis: Reading the Market’s Mood

    At times, even seemingly robust stocks plummet with a single negative headline. And this is where Sentimental Analysis comes into the picture. Sentimental analysis seeks to gauge how traders and investors feel about the general market or individual stocks. They are often influenced by factors external to the companies and thus may not always reflect fundamentals. Market behavior is ruled by emotion.

    What Influences Market Sentiment?

    • Breaking News (such as war, elections, fraudulent activities) 
    • Economic Events (interest rates, reports of inflation) 
    • Global Markets (movements in Dow Jones, Nikkei, FTSE) 
    • Government Policies (budgets, regulations) 
    • Natural Disasters/Pandemics
    • Economic Events 
    • Investor Emotions (fear, greed, panic, euphoria)

    It’s many times that we see the markets moving on feelings and not on facts. For instance, the announcement of a much better earnings report can still result in a decline of the stock price if the investor was expecting an even bigger profit.

    Tip: Tools like the Fear & Greed Index, news aggregators, or economic calendars come in handy to keep sentiments in check. An early shift in sentiment will always prove to be an early indication for reversals.

    Mallinath Mulage, CEO of The Safe Trader Academy, an experienced stock market mentor, said, “Fundamental Analysis plays 10% role while Technical Analysis plays 90% role in trading success.”

    • Fundamentals help you filter out poor stocks and focus on potential winners.
    • Technicals help you make money by finding the right entry and exit points.
    • Sentiment keeps you alert to unpredictable shifts driven by external events.

    When combined wisely, these three create a powerful strategy for anyone trading the markets.

    Why You Need All Three

    While each analysis serves a purpose, using them together provides a well-rounded strategy:

    Type of AnalysisRole It PlaysBest For
    Fundamental AnalysisStock and sector selectionLong-term investing
    Technical AnalysisTiming entry and exitShort- to medium-term
    Sentimental AnalysisUnderstanding market mood and volatilityNews-based movement

    Successful traders know when to mix logic, emotion, and timing.

    Practical Tips to Apply These Analyses

    1. Start with Fundamentals: Screen for quality stocks with strong financials.
    2. Use Technicals: Identify the right price levels and chart patterns before buying.
    3. Track Sentiment: Stay updated with news, events, and global trends that may cause sudden market moves.
    4. Risk Management: Regardless of analysis, always protect your capital with stop-losses.
    5. Keep a Trading Journal: Record why you entered/exited a trade to improve your process.

    Conclusion: 

    Successful trading and investing is not about predicting the future—it’s about preparing for it using every tool available.

    • Use Fundamental Analysis to choose what to buy.
    • Use Technical Analysis to decide when to buy or sell.
    • Use Sentimental Analysis to understand why the market might behave unexpectedly.

    Each type of analysis is a piece of the puzzle, and when combined, they provide clarity in the often-chaotic world of trading.

    👉 Join The Safe Trader Academy today and start trading like a pro.

    Join our free Telegram Channel

  • Nifty50 Index Options: 24-Year Milestone

    Nifty50 Index Options: 24-Year Milestone

    Nifty50

    The National Stock Exchange of India (NSE) marked a significant milestone on June 4, 2025, celebrating 24 years since the launch of index options on the Nifty50 Index. Launched on June 4, 2001, the Nifty50 index options paved the way for robust derivatives trading in India, bringing new opportunities for investors and traders to manage risk and generate returns.

    A Look Back: The Beginning of Nifty50 Index Options

    On June 4, 2001, NSE initiated the trading of index options, more specifically on the Nifty50 Index. This had been one giant leap for the Indian capital markets, empowering the market participants with an awesome hedge tool against the risks and to speculate on the broader market movements.

    From then on, the Nifty50 index options have tremendously grown in popularity to become one of the important players in the Indian derivatives market.

    Expanding the Options Universe: Beyond Nifty 50

    Having acknowledged the varied needs of market participants, NSE has, with time, enriched its Index Options offering. Presently, Index Options are available on five key indices, each serving a separate sector and market segment:

    ✅ Nifty 50: Neighborhood’s foremost index representing the top 50 blue-chip companies.

     ✅ Nifty Bank: Indian banking and financial sector companies of the highest order.

     ✅ Nifty Next 50: Constituted by the next 50 large-cap stocks outside the Nifty 50 for growth prospects.

     ✅ Nifty Midcap Select: Exposure to mid-cap companies, in between large and small firms.

     ✅ Nifty Financial Services: Targets the vibrant financial services sector of India, including NBFCs and insurance.

    With such expansion, it ensures that traders have more opportunities to engage in India’s dynamic markets across various sectors and market capitalizations.

    📘 Nifty 50 Stocks List (2025)

    Stock NameStock NameStock NameStock NameStock Name
    ADANIENTGRASIMNESTLEINDTATASTEELAPOLLOHOSP
    ADANIPORTSHCLTECHNTPCTCSASIANPAINT
    AXISBANKHDFCBANKONGCTECHMBAJAJ-AUTO
    BAJFINANCEHDFCLIFEPOWERGRIDTITANBAJAJFINSV
    BPCLHEROMOTOCORELIANCEULTRACEMCOBHARTIARTL
    BRITANNIAHINDALCOSBILIFEUPLCIPLA
    COALINDIAHINDUNILVRSBINWIPRODIVISLAB
    DRREDDYICICIBANKSHREECEMLTIMEICHERMOT
    INDUSINDBKINFYSIEMENSLTIITC
    JSWSTEELKOTAKBANKM&MTATACONSUMMARUTI

    Diverse Contract Tenures for Flexibility

    A strength of NSE derivative markets is flexibility. Trading starts on Fridays and closes on Thursdays for all Index Options contracts to ease risk management for traders. The NSE has various tenures for each strategy:

    • Weekly expiries: Nifty 50, short-term strategies and volatility plays.
    • Monthly expiries: For all five indices, suited for swing and positional trade.
    • Quarterly expiries: For Nifty 50 and Nifty Bank, suiting a longer-term view of the market.
    • Half-yearly expiries: For Nifty 50, for longer horizon planning.

    These multivariate tenures allow traders to finely manage their positions, modify strategies, and mitigate risks.

    Global Recognition for NSE

    Adding to its achievements, NSE has been recognized globally as the World’s Largest Derivatives Exchange for the 6th consecutive year in 2024, based on the number of contracts traded. This recognition underscores NSE’s leadership in providing transparent, efficient, and innovative trading infrastructure to participants worldwide.

    Why the Nifty50 Index Matters

    The Nifty50 is India’s country’s benchmark stock market index and represents the first 50 large-cap companies listed on the NSE. It spans several sectors such as banking, IT, energy, FMCG, etc. Being considered a barometer of economic India, it is closely followed by investors, traders, and policymakers.

    Due to its high liquidity, the index is a favorite for trading of derivatives in futures and options. Nifty50, with a track record of centuries, with a high amount of participation remains an important instrument for risk management and opportunity leverage in India’s dynamic market.

    Benefits of Trading Index Options

    Diversification & Hedging Possibilities:

     An index option provides the investor or trader an opportunity to hedge the whole portfolio or a sector-specific basket against any adverse market movement.

    Lower Margin Requirements:

     Traditionally, lower margins are assigned to index options as compared to those on single stocks, thus marketing them to a broader audience.

    High Liquidity:

     The Nifty50 options segment practically assures liquidity, making it easy for investors to enter and exit trades.

    Risk Management & Flexibility:

     Index options are good tools to manage market-wide risk. They are flexible tools that can be employed in numerous strategies: income generation, hedging, or taking directional bets.

    Final Thoughts

    As NSE celebrates 24 years of Nifty50 index options trading, it’s clear that the exchange has played a transformative role in India’s capital markets. With cutting-edge infrastructure, robust risk management systems, and a growing suite of index options, NSE continues to be the cornerstone for Indian investors and traders.

    Whether you’re a beginner exploring index options or a seasoned trader refining your strategies, the Nifty50 and other index options offer immense potential. Let’s look forward to many more years of growth, learning, and opportunities!

    👉 Join The Safe Trader Academy today and start trading like a pro.
    join our telegram channel

  • Mastering Trading Psychology

    Mastering Trading Psychology

    Mastering Trading Psychology

    To most people, traders who trade successfully are associated with complicated algorithms, powerful trading platforms, or insider knowledge. Although some of these things might be a factor, it is probably not the least commonly accepted secret weapon that consistently profitable traders wield—trading psychology.

    Mastering one’s mind is more important than mastering any chart pattern or indicator. In actuality, it is the ability to control emotions and maintain mental discipline with every single decision which separates the winners from the losers in the long-term view.

    At The Safe Trader Academy in Hyderabad, we teach our students that mastering the mind is even more important than mastering the market.

    In this blog, we will discover how emotions like fear, greed, overconfidence, and doubt hinder traders and how they can work on conditioning the mind to trade professionally.

    What Is Trading Psychology?

    Trading psychology is the set of emotions and mental states that influence the decisions made by a trader. It consists of fear, greed, hope, overconfidence, discipline, patience, and regret. Unlike technical analysis or fundamental analysis, trading psychology deals with how you react to market behavior rather than with what the market actually does. 

    It affects heavily when and how you: 

    • Enter trades 
    • Hold positions 
    • Exit trades 
    • Avoid unnecessary risks 

    Two big emotions in trading are:

    • Fear: It fears the trader into exiting a trade prematurely or into hesitating to enter, thus missing out on opportunities.
    • Greed: It pushes the trader to chase profit, overtrade, or hold onto losses for too long.

    Understanding these emotions—and how to control them—is key to becoming a successful trader.

     Top 7 Psychological Mistakes Traders Make

    Fear of Losing

    • Fear to enter valid trades or fearful to hold them for long enough.
    • Solution: Accept losses as a part of the trade setup. Use risk management in such a way that it can always save you from disastrous losses.

    Overtrading

    • From revenge trading or screen addiction.
    • Solution: Trade within a certain number limit for each session. Trade for quality, not quantity.

    Lack of Discipline

    • Ignoring stop losses, targets, or any rule-based systems.
    • Solution: Take a checklist with you for every trade to help maintain discipline. 

    Chasing the Market (FOMO)

    • Late entries due to fear of missing out.
    • Solution: Trust your strategy, wait for setups, and enter with confirmation.

    Greed

    • Holding positions for longer in hopes of more profit.
    • Solution: Use a set risk-reward ratio and exit accordingly.

    Ignoring Mental Health

    • Stress, anxiety, or too much screen time harms clarity.
    • Solution: Take breaks, run, meditate, and get a good night’s sleep.

    Lack of Self-Awareness

    • Repeatedly committing the same errors and never contemplating modus operandi.
    • Solution: Maintain a trading journal and review it every week to identify trading patterns.

    5 Ways to Build a Winning Trading Mindset

    1. Create Your Trading Plan 

    Outline your:

    • Entry and exit criteria
    • Capital at risk per trade
    • Trading schedule
    • Position-sizing strategy

    If you have a clear plan, emotional decisions won’t interfere.

    2. Record Every Trade

    Track:

    • Reasons for entering the trade
    • State of emotion before/after
    • Mistakes and lessons learned

    This approach achieves more self-awareness and faster learning. 

    3. Visualization & Affirmations

    Now, use positive self-talk to reprogram your trading mindset:

    • “I follow my plan.”
    • “Losses are part of trading.”
    • “I stay calm and confident.”

    4. Simulate High-Stress Scenarios

    Use stressful demos like extremely fast markets or drawdowns to condition your emotional responses so that you don’t crumble under pressure.

    5. Join a Trading Community

    Being part of a like-minded tribe like The Safe Trader Academy offers:

    • Emotional support
    • Accountability
    • Regular mindset check-ins

    Why Most Traders Fail: It’s Not the Strategy, It’s the Psychology

    The stock market is full of traders who know what to do but fail to do that at the right moment.

    Why should that be?

    Because psychology gets in the way. Fear wins over logic. Greed drowns out the voice of caution. Doubt makes that person hesitate to act. A dangerously inflated ego will just push the limit beyond what should have been. 

    A trader’s worst enemy isn’t the market — it’s often themselves.

    The Role of Subconscious Beliefs in Trading

    Your beliefs about money, success, and failure impact your trading performance far more than you realize.

    If you subconsciously believe:

    • “I don’t deserve to make money easily,”
    • “Making profit is always hard,”
    • “I always mess up when it matters most,”

    …you will sabotage your own trades, no matter how good your setup or system is.

    That’s why mental reprogramming techniques — affirmations, journaling, and subconscious rewiring — are critical parts of our Trading Psychology Course at The Safe Trader Academy.

    Real Success Comes from Emotional Control

    A trader with an average strategy but strong psychology will consistently outperform a trader with a brilliant strategy and a weak mindset.

    Controlling emotions isn’t optional—it’s the key to consistency and long-term profits.

    Why Most Traders Fail — And How You Can Avoid It

    Let’s be honest — 95% of traders lose money.

    But it’s not because they didn’t learn candlestick patterns. It’s because they:

    • Overreact emotionally
    • Trade without discipline
    • Ignore mindset development

    The 5% who succeed?
    They treat trading like a mental sport — where emotions are trained, not ignored.

    Why Choose The Safe Trader Academy for Trading Psychology?

    At The Safe Trader Academy, we do more than teach setups.

    We train the mind behind the trades.

    Every course includes:

    • Trading Psychology Mastery Module
    • 1-on-1 Mindset Coaching
    • Live Market Feedback & Journaling Tools
    • Access to a Private Community of Disciplined Traders
    • Mental Conditioning Exercises & Challenges

    Conclusion: Mind Over Markets

    Mastering trading psychology is not a one-time achievement—it’s an ongoing process of self-awareness and discipline. The best traders treat their mindset like a muscle: they train it daily, evaluate it regularly, and protect it fiercely.

    Remember, the market doesn’t control your success—you do.
    And the real edge is not in the market, but in how you think, feel, and act within it.

    👉 Join The Safe Trader Academy today and start trading like a pro.

    Join Our Telegram channel
  • Intraday Tips for Consistent Profits

    Intraday Tips for Consistent Profits

    Intraday Trading

    The process of Intraday Trading involves the acquisition and sale of stocks or indices within the same trading day. Hence, it offers an opportunity for daily income. Without the proper approach, many traders battle inconsistent results and long strings of losses.

    In this blog, we will look at 10 important concepts that professional intraday traders use to make sure they remain consistently profitable. Get ready for that intraday upgrade.  Let’s dive in!

    What is Intraday Trading?

    Intraday trading, thus sometimes referred to as day trading, has to do with opening and closing property during a trading session. Unlike in swing or positional trading, intraday traders try to derive profits from short-term price movements that happen during the day.

    Quick facts about intraday trading:

     ✅ Positions closed before market close – no risk at night.

     ✅ Traders rely mainly on technical analysis and short-term trend analysis.

     ✅ Highly liquid stocks and indices, such as Nifty and Bank Nifty, are preferred.

     ✅ Must adhere to a disciplined risk management system in order to avoid any large drawdowns.

    10 Proven Intraday Trading Techniques

    Opening Range Breakout Strategy

    One of the best-loved strategies for active traders is the Opening Range Breakout. It involves watching the market for 15 minutes (from 9:15 AM to 9:30 AM in India).

    How it goes:

     🔹 Mark the high and low of this opening range.

     🔹 Price breaking above the high on strength of volume would mean a bullish breakout.

     🔹 Price breaking below the low would mean a bearish breakout.

     🔹 Confirming indicators like VWAP or volume spike could give greater reliability.

    Pro tip: Run your trades on Bank Nifty or stocks with high liquidity to get the best results from this strategy.

    VWAP Reversion Strategy

    The Volume Weighted Average Price (VWAP) is a rather popular indicator used in the institutional realm to denote the arithmetic average price weighted by volume through the trading session. 

    How to use VWAP:

     ✅ Buy on dips to the VWAP line in an uptrend.

     ✅ Sell on rallies to the VWAP line in a downtrend.

     ✅ VWAP acts as dynamic support/resistance during the session as well.

    This strategy is perfect for entering pullbacks with really tight risk-just the way professional day traders love it.

    The EMA Crossover Entry

    The Exponential Moving Average (EMA) crossover is a classic strategy for capturing short-term trends.

    How it works:

     🔸 Use the 9 EMA as the fast one and the 21 EMA as the slow one.

     🔸 When the 9 EMA crosses over the 21 EMA and price moves higher, it becomes a bullish signal.

     🔸 When the 9 EMA crosses below the 21 EMA, it becomes a bearish one.

     🔸 Use momentum indicators like MACD or RSI to confirm and eliminate false signals.

    It is good for momentum trades and trending markets!

    Support-Resistance Flip

    Support and resistance zones formed during the previous trading day prove to be critical levels for intraday traders.

    How to use it:

    ✅ Mark levels like PDH (Previous Day High), PDL (Previous Day Low), and POC (Point of Control).

     ✅ When the price breaks these levels and retests them, they usually flip from support to resistance or vice versa.

     ✅ Use candlestick patterns for confirmation (pin bar, engulfing candle).

    This simple but extremely effective method facilitates detecting intraday reversal and breakout trades on a higher probability basis.

    Momentum Scalping Strategy

    For traders who love fast action, momentum scalping is a go-to approach.

    How to execute:

     🔹 Use the screener tools at your disposal, such as Finviz, TradingView, or your broker’s scanner, to find high-volume stocks attached to news catalysts or with a strong pre-market move.

     🔹 Buy on breakout candles alongside volume confirmation.

     🔹 Take profits quickly while targeting a quick reward-to-risk ratio of 1:1 or 1:2.

     🔹 Exit quickly as momentum hardly lasts!

    Scalping techniques for intraday trades are best for snagging any small moves in the market without watching the market get choppy. 

    Breakout-Retest Confirmation

    Do you want to know why some breakouts fail? They do breakouts without much conviction. Hence, one should consider waiting for a retest following the breakout level.

    How to perform:

     ✅ Let price break above (below) a key level first.

     ✅ Wait for it to retest that level-it tells if the breakout is genuine.

     ✅ Enter upon confirmation of the retest with a tight stop loss.

    ✅ Works well on Nifty BankNifty futures, especially when trading with institutional momentum.

    Relative Strength (RS) – Intraday Picks

    Different stocks move differently for the markets. There lies some relative strength against the broader markets.

    How to trade RS:

     🔹 If the Nifty remains flat and a stock like Reliance shows buying momentum breaking highs, just pay attention to that stock.

     🔹 If, on the other hand, Nifty is heading lower whereas a stock seems to be holding on strong, go for that outperformer.

     🔹 Perform scans on RS or intraday watchlist to look for these outperformers.

    This helps in filtering out those stocks which can do better in anybody’s market. 

    News-Driven Scalps

    The news Intraday moves fast! From directly breaking news of RBI policy changes, corporate earnings, or global headline news – any news that triggers volatility can present opportunities for quick profits.

    Key pointers:

     ✅ Stick to liquid, high-beta stocks or indices reacting to news.

     ✅ Immediate breakout trades with tight stop-losses only – the news volatility may suddenly reverse.

     ✅ Do not hold news trades for long – go for quick scalps only.

    Gap Trading for Intraday

    Gaps caused by pre-market moves or global news can result in one of the largest intraday moves.

    How to approach gaps:

     🔹 Use pre-market data and global cues to identify potential gap-ups or gap-downs.

     🔹 After 15 minutes, check if the price continues in the gap direction or starts to reverse.

     🔹 Example: Infosys gaps up on strong earnings — watch for a retest of the gap zone and subsequent continuation for a safer entry.

    Gaps can provide strong trade setups if traded with a defined plan.

    Volume Surge Breakout

    Volume is usually the earliest indicator of a strong move. Using volume spikes will allow you to catch breakouts before they become obvious.

    How to use it:

     ✅ Observe for a sudden surge in volume on your intraday chart (5-min or 15-min).

     ✅ Trade breakouts accompanied by this volume surge.

     ✅ Complement with other breakout setups like ORB for high-conviction trades.

    Best Intraday Time Frames:

    PurposeTimeframe
    Strategy Setup15 min
    Entry & Confirmation5 min
    Trend Analysis30 min
    Risk Management1 min

    Intraday Risk Management Essentials:

    📌 Never risk more than 1-2% of your capital on a single trade.
    📌 Always set a predefined stop-loss and target before entering any trade.
    📌 Avoid overtrading – focus on 2-3 high-quality setups per day.
    📌 Keep a trading journal to review your performance and identify patterns.
    📌 Stay calm, disciplined, and don’t let emotions drive your decisions!

    Conclusion: Unlock Your Intraday Trading Potential

    Intraday trading is highly effective in collecting daily profits consistently; however, success necessitates more than just luck. Once you’ve mastered 10 techniques from opening range breakouts to volume spike confirmations, you’ll be well set to confidently navigate fast-paced markets.

    At The Safe Trader Academy Hyderabad, we empower our traders with expert guidance, live market training, and a supportive community to fast-track your journey. Practice these strategies daily, polish your skills each day, and see your trading shift gears from questionable to profitable.

    Remember: Intraday trading mastery is a marathon, not a sprint. Stay focused, stay disciplined, and keep learning.

    👉 Join The Safe Trader Academy today and start trading like a pro.
    Join our telegram channel
  • Top Options Trading Strategies for Weekly Income

    Top Options Trading Strategies for Weekly Income

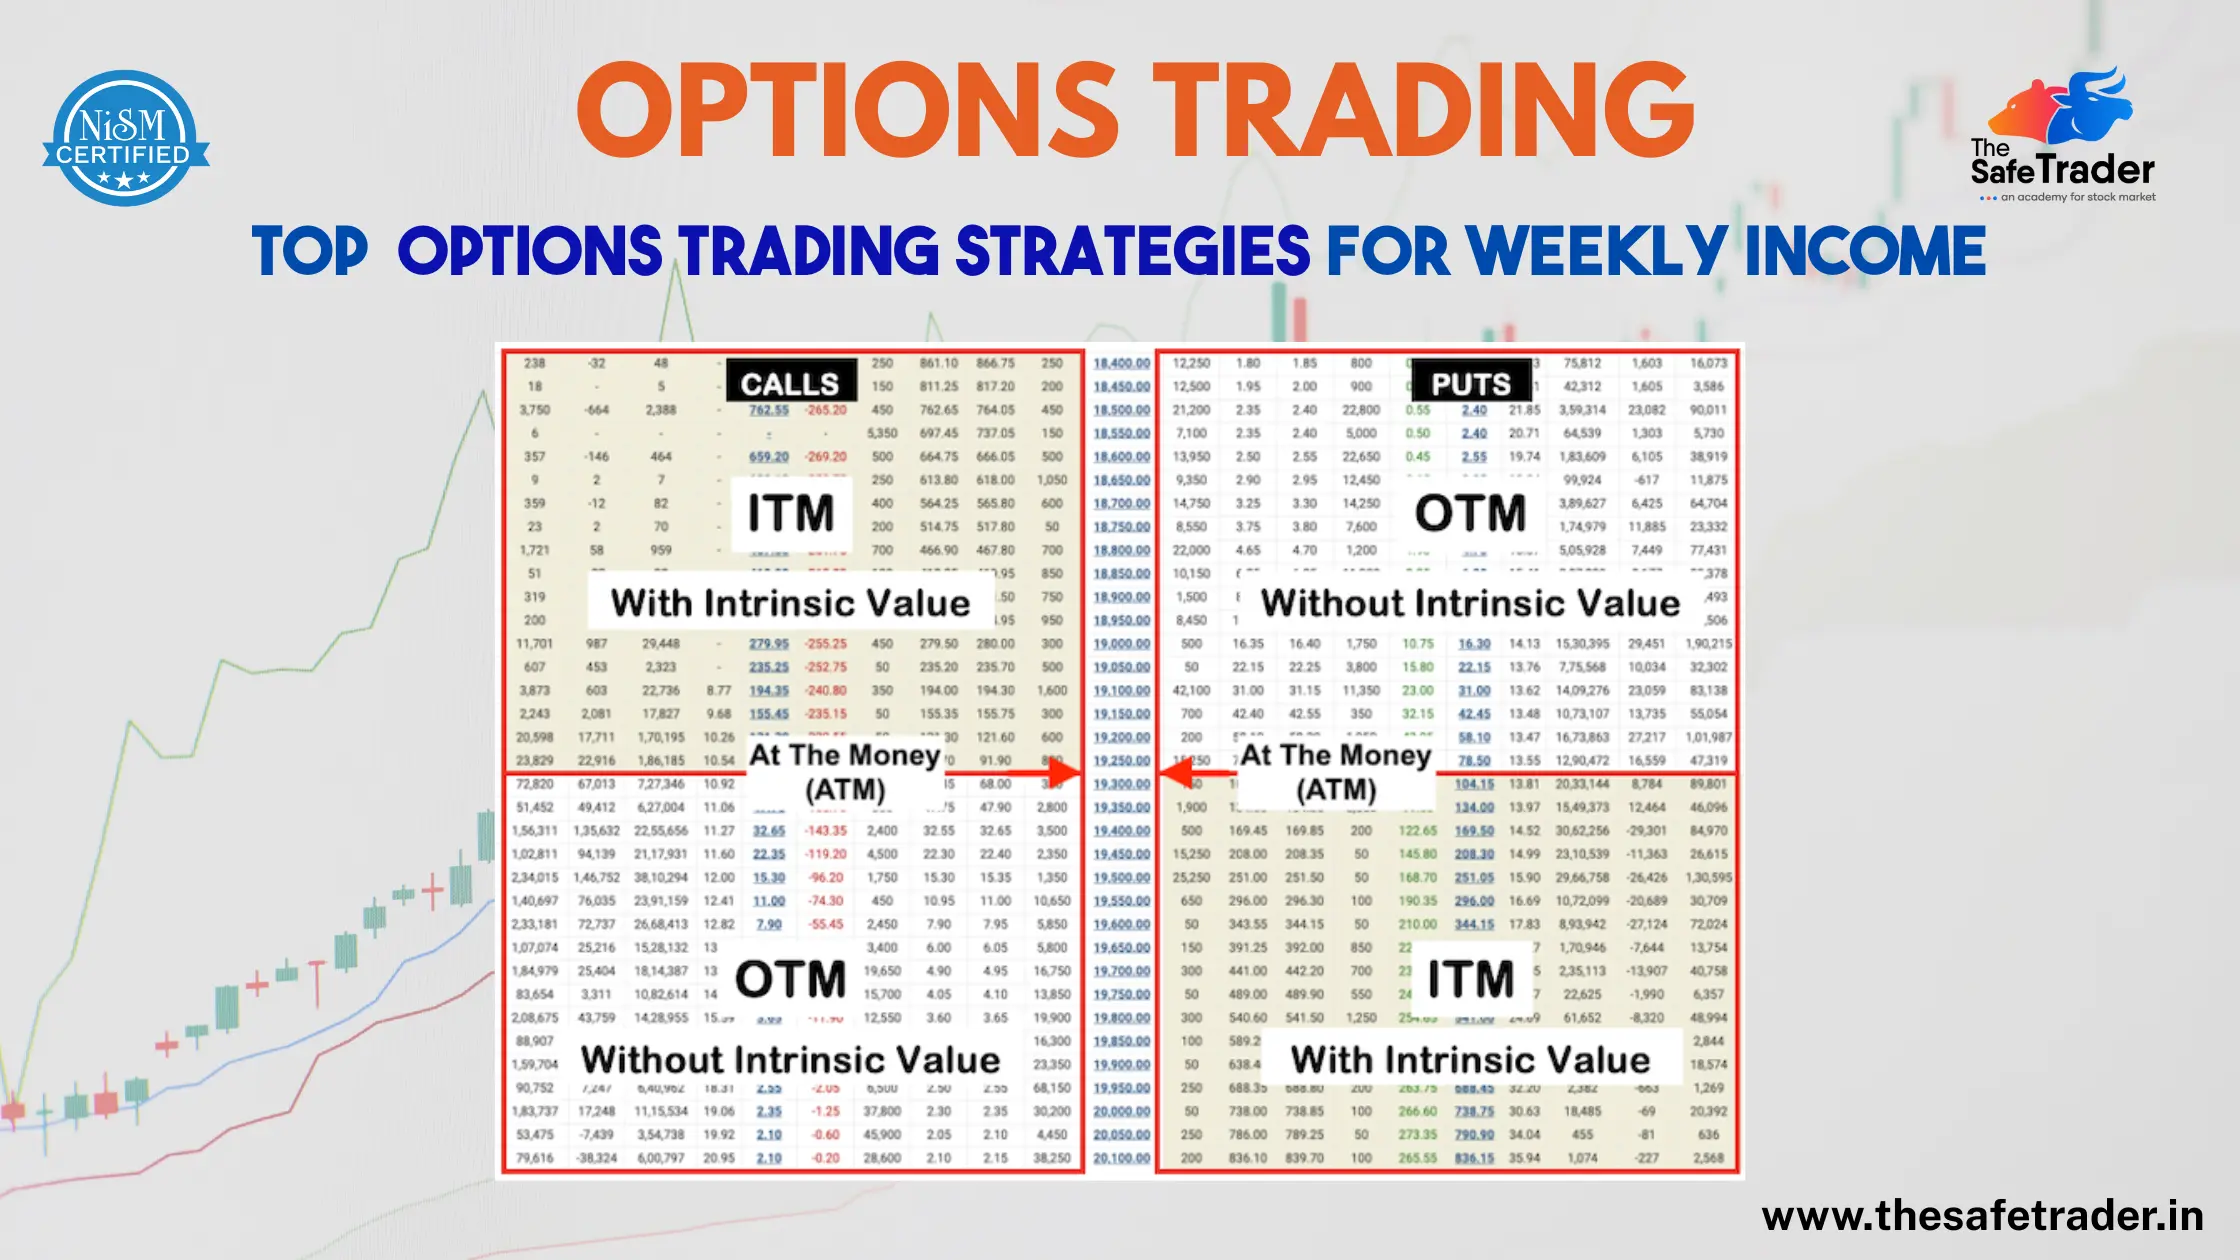
    Options Trading

    Thousands of retail traders in India jump into Nifty and BankNifty options every week hoping to make fast money. But the truth is, only a small percentage of them use proper strategies. The rest depend on luck or random tips—and often end up in losses.

    In this blog, we unveil the Top 7 Options Trading Strategies that will help you:

    • Trade confidently
    • Keep your risks in check
    • Accumulate steady profits on a weekly basis

    What is Options Trading?

    Before diving into the strategies, let’s quickly understand what Options Trading is.

    An option is a financial instrument that gives you the right, but not the obligation, to purchase or sell an underlying asset (such as Nifty, BankNifty, or stocks) at a specified price on or before a particular date.

    There are two types of options:

    • A Call Option is purchased when the buyer wants to profit from a rise in the price of the underlying asset.
    • A Put Option is purchased when the buyer expects the price of the underlying asset to decline.

    By using options, you can:

    ✅ Speculate on price movements

    ✅ Hedge your existing positions

    ✅ Generate income in range-bound markets

    Top 7 Options Trading Strategies for Weekly Income

    1. The Iron Condor Strategy  | Income from Sideways Markets

    What It Is:

    Non-directional strategy wherein you receive money when the price remains in a certain range. 

    How It Works:

    1. Sell one Out -of-the -Money (OTM) Put
    2. Sell one Out-of-the-Money (OTM) Call
    3. Buy one further OTM Call (for protection)
    4. Buy one further OTM Put (for protection)

    The profit consists of premiums collected so long as the price remains in the range between the two options sold.

    Ideal For: Those traders who have low-volatility expectations (sideways) such as a mid-week session or consolidation. 

    Why Should a Beginner Give This a Shot:

    Risk is limited; setup is easy to understand and executes well during calme hours-this will boost your confidence.

    💡 Pro Tip: Employ this in expiration weeks when markets tend to settle and stay flat after the big move.

    2. Bull Call Spread – Low-Cost Strategy in a Rising Market

    What It Is:

    Strikes a balance between making money from moderate upward movement in the market and not spending too much on premiums.

    How It Works:

    1. Buy one In-the-Money (ITM) Call option
    2. Sell one Out-of-the-Money (OTM) Call option

    The money you receive from selling the OTM call reduces the cost of buying the ITM call.

    Ideal For: A slowly bullish market— not too strong but continuously upward.

    Why Should a Beginner Try This:

    Because it limits profits, as well as loss, it presents a controlled risk in learning how calls behave.

    3. Bear Put Spread – Profit from Falling Markets

    What It Is:

     A bearish approach allowing you to make money when you expect the market to fall down gradually.

    How It Works:

    1. Buy one ITM Put
    2. Sell one OTM Put

    Much similar to the Bull Call Spread, this strategy reduces cost and limits risk. So you are betting that the price will go down-but not drastically down.

    Ideal For: Use when you expect a gradual downtrend in Nifty or Bank Nifty.

    Why Should a Beginner Try This:

    It’s safer than buying a naked put and gives you a taste of bearish trading with limited risk.

    4. Short Straddle – Expiry Day Premium Killer

    What It Is:

     A strategy where an investor sells both a Call and a Put at the same strike price.

    How It Works:

    1. Sell one ATM Call
    2. Sell one ATM Put

    You make money from the decay of the premium, which accelerates as time passes, especially on the day of expiry if the market hardly moves.

    Ideal For: Expiry day, especially when low volatility is expected.

    ⚠️ Risk Alert: If the market moves violently, losses can be huge. Use strict stop-loss orders while about this strategy.

    Why Beginners Should Be Cautious:

     Do not attempt unless you are confident of your price action knowledge and stop-loss management.

    5. Long Strangle – Big Move? Big Profit

    What It Is:

     A direction-neutral strategy that benefits from huge market movement in any direction.

    How It Works:

    1. Buy one OTM Call
    2. Buy one OTM Put

    When the market moves sharply higher or lower, profits on one leg of the trade will be substantial and far outweigh the losses on the other leg.

    Ideal For: Cases when you expect high volatility such as:

    • RBI policy announcements
    • Election result
    • US Fed meetings
    • Major global news

    Why Beginners Should Try This and Not Another: 

    You can participate in market events with limited risk and clear payoff structure.

    6. Intraday Scalping with Options – Fast Profits in Minutes

    What It Is:

    This is a very short-term trading technique that enters and exits trades in a matter of minutes on the basis of price momentum.

    How It Works:

    • Study 3- to 5-minute charts for breakout/ breakdown momentum in Nifty/BankNifty
    • Trade with ATM or ITM options
    • Book in profits at 20-30%, or exit quickly if the trade turns against you

    Best For: Days when the market moves fast or sessions triggered by news announcements.

    🎯 Join The Safe Trader Academy’s Live Sessions to scalp with experts.

    Why Beginners Should Learn First:

    Scalping needs quick decisions and strong discipline—start only under mentorship to avoid emotional mistakes.

    7. Covered Call- Passive Income for Stockholders

    What It Is:

     A way to earn some income from stocks you already have by selling call options against them.

    How It Works:

    1. Buy and hold a quality stock in your Demat account
    2. Sell an OTM call option on that stock
    3. Earn weekly/monthly income from the premium

    If the stock price does not cross the strike price, you keep both your stock and the premium.

    Best For: Positional or long-term traders who wish to enhance their returns.

    Why Beginners Should Love This:

     It’s a really safe way to learn options while still being an investor in stocks.

    When to Use These Strategies?

    StrategyBest Market ConditionRisk Level
    Iron CondorSideways / Range-boundLow
    Bull Call SpreadMild UptrendMedium
    Bear Put SpreadMild DowntrendMedium
    Short StraddleExpiry Day / Flat MarketHigh
    Long StrangleHigh Volatility / Event DaysMedium
    Intraday ScalpingTrending / Fast MarketsHigh
    Covered CallLong-term Stock HoldingsLow

    🎯 Final Thoughts

    Consistency in options trading is not about luck — it’s about strategy, discipline, and practice. The top traders don’t trade everything; they master a few key setups and execute them with precision.

    Ready to build weekly income through options trading?

    👉 Join The Safe Trader Academy today and start trading like a pro.

    Join our telegram channel


  • What Is a Prop Desk? – A Professional Guide

    What Is a Prop Desk? – A Professional Guide

    Prop Desk

    As the financial markets evolve, more traders are exploring unconventional paths to grow their careers without relying on their personal savings. One of the most talked-about options in this space is proprietary trading, commonly known as prop trading. This article breaks down what a Prop Desk is, why it’s growing in popularity, and how you can get started—plus a special opportunity for forex traders in Hyderabad.

    What Is a Prop Desk? 

    A Proprietary Trading Desk is a department within a trading firm where traders with all levels of experience conduct trades for various financial markets-emerging markets, equities, forex, commodities, and derivatives-to generate profits for the firm itself, not for executing trades on behalf of clients.

    Unlike a commission-based brokerage, rather than just executing buy or sell orders generated by customers, a main source of earnings for a prop desk comes from putting some market risk on the line with razor-sharp trading maneuvers. As a trader on the prop desk, you are not risking your own money, but managing the firm’s money and sharing the profits. 

    Some prop desks are an in-house function within an investment bank or hedge fund, while others operate as stand-alone entities just concerned with prop trading.

    Why Is Prop Trading So Popular?

    In recent years, prop trading has exploded in popularity, and here’s why:

    1. Low Barrier to Entry (for Skill-Based Traders)

    You don’t need much capital anymore to go into the trade—rather, you need skills, discipline, and strategy.

    2. Career Growth

    Considered a lucrative career option, prop trading may enable successful prop traders to migrate onward to management of large portfolios or launching of hedge funds.

    3. Technology and Tools

    Besides that, these companies provide traders with charting software, algorithmic systems, and execution tools very expensive to acquire individually for any retail trader.

    4. Compensation on Basis of Performance

    Earnings here do not have any limits. You are compensated entirely on basis of how well you perform. If consistently profitable, great fortunes can be made.

    5. Lack of Conflict of Interest

    Traders and brokers are adversaries-the broker profits from commissions against the traders. Whereas the prop trading company is successful only if you are.” 

    Pros and Cons of Prop Trading

    Pros

    • Capital Access: With the funds made available to you, you could employ bigger bets to make a bigger profit.
    • Leverage: Many firms provide for internal leverage thereby bigging up your exposure while avoiding margin calls. 
    • Infrastructure: Take advantage of structural trading services with real-time data feeds and risk monitoring. 
    • Support and Community: The working environment is competitive but also collaborative, where traders can learn from each other. 

    Cons

    • Under Performance Pressure: You hold your position or funding, only by performing.
    • Profit Sharing: You usually keep a percentage (often 60%–80%) of the profits, not 100%.
    • Structured Rules: Some firms impose strict stop-loss rules, daily loss limits, or force you to trade certain markets or strategies.
    • Training and Evaluation Periods: Newcomers often must prove themselves on demo or simulation accounts before getting funded.

    Things to Keep in Mind Before Joining a Prop Desk

    For a great experience, remember these important tips:

    1. The Reputation of the Firm

    Research the prop firm. Are they clear about their fees or charges? About training? About payouts? Are the success stories real? 

    2. The Funding Model

    Some prop firms demand a flat fee or security deposit, and some do not. The former requires lowered performance metrics in return.

    3. Training and Mentorship

    Are you offered structured training at the desk? Do you gain access to esteemed mentors? 

    4. The Payout Seasons and Sharing Percentages

    Understand how often you will be paid (monthly, biweekly, quarterly), and what share of the profits you get to keep. 

    5. Trader Freedom

    Can you use your own strategy, or can you only trade on a preset system? Find one that speaks to your trading personality.

    How to Find the Best Trading Strategy for Prop Desk

    There’s no single best trading strategy, but there are a few avenues to explore:

    • Scalping

    Short trades that last seconds or minutes. Best for highly liquid markets such as forex or index futures. Demands discipline and quick decision-making.

    • Intraday Trading

    Open and close trades within the same trading day. It works best in volatile markets where the price keeps moving.

    • Swing Trading

    Hold trades for a couple of days. This strategy generally mixes technical setups with broad market analysis.

    • Quantitative/Algorithmic Trading

    Trading on the basis of coded algorithms that scan, enter, and exit trades. Prop firms particularly love quant traders, especially those who have developed their own models.

    • Event-Driven Trading

    Trade around earnings, policy changes, or news announcements. It’s a high-risk, high-reward trading option.

    Backtest your idea thoroughly with the help of historical data before finally committing yourself to a trading strategy; then demo trade until you gain confidence in its real-time appeal.

    Who Is Eligible for Prop Desk?

    Most prop firms have some minimum requirements such as:

    • 18 years of age or older
    • Basic Market Knowledge
    • Good Analytical Skills
    • Strong Discipline and Risk Management
    • Technical or Quantitative Skills (preferred)

    While experience is very helpful, there are firms that are willing to provide some training for candidates that show promise. Some may require you to undergo an evaluation phase first before they actually commit to giving you live capital.

    Join The SafeTrader Academy ‘s New Prop Desk for Forex Traders!

    If you’re based in India and serious about a forex trading career, here’s an exciting opportunity:

    The SafeTrader Academy in Hyderabad has launched its Proprietary Trading Desk for Forex Traders. Whether you’re a self-taught trader or an experienced market participant, this platform offers the tools, capital, and support you need to succeed.

    Benefits of Joining:

    • Trade using the firm’s capital—no risk to your own funds
    • Keep up to 70% of profits
    • Access to expert mentorship and structured training
    • Cutting-edge forex trading platforms
    • Evaluation programs for beginners to qualify for live capital

    This is a great way to turn your trading passion into a profession, especially if you’re ready to take it full-time.

    To apply or learn more, contact The SafeTrader Academy in Hyderabad and book your onboarding session.

    Final Thoughts

    A prop desk isn’t just a job—it’s a launchpad for serious traders who want to grow their careers without financial constraints. If you’ve developed a solid trading strategy, understand risk, and are eager to scale, proprietary trading could be your ideal path.

    As with anything, choose your firm carefully, know your strengths, and keep learning. With dedication, the right strategy, and discipline, prop trading could be one of the most rewarding paths in the financial markets.

    🚀 Ready to Get Started?

    If you’re looking to take the next step, consider joining The SafeTrader Academy’s Prop Desk and begin your journey as a funded forex trader.

    👉 Enroll today and become a smarter, safer trader.

    Join our telegram channel

  • May 2025 IPO Listings: Complete Guide for Investors

    May 2025 IPO Listings: Complete Guide for Investors

    IPO

    What is an IPO?

    An Initial Public Offering, or IPO, is the very first undertaking a privately held company aims to offer shares to the public. Thus, the company lists its stock on a public stock exchange (such as NSE or BSE in India), and investors acquire and trade its shares.

    Put simply, an IPO is how a company changes its status from privately owned, usually by its founders, their family, and early investors, to publicly traded with shares owned practically across the market. 

    Why Are IPOs Initiated by Companies?

    Companies get listed on the public stock exchange due to a large plethora of strategic and financial reasons:

    1. Raise Capital for Growth

    Companies raise money via IPOs in stretches of hundreds of millions for financing expansion plans, R&D expenditures, infrastructure, purchase, or reduction of debts.

    2. Enhance Credibility and Visibility

    The very fact of being listed gives the company a powerful brand image and market presence that can now attract new customers, business partners, and talented employees.

    3. Provide Liquidity

    The IPO presents an opportunity for existing investors and early-stage backers to liquidate or trade their shares in the open market.

    4. Employee Incentives

    Listed companies can also provide stock incentives such as employee stock option plans (ESOPs) to attract and retain talent.

    Key Terms to Know

    • DRHP (Draft Red Herring Prospectus): This is a preliminary document filed with SEBI, containing details of the company, its financials, and the IPO. 
    • Price Band: The price within which investors may bid for shares in the IPO. 
    • Lot Size: The least number of shares for which application may be made. 
    • Listing Date: The date on which stocks start trading on the exchange. 
    • Oversubscription: When demand for shares exceeds the number of shares on offer.

    Types of IPO Investors

    • Retail Investors: Individual investors applying for shares less than ₹2 lakh.
    • High Net-Worth Individuals (HNIs): Individuals applying for shares above ₹2 lakh.
    • Qualified Institutional Buyers (QIBs): Large financial institutions such as mutual funds, insurance companies, and foreign investors.

    IPOs as an Investment Opportunity

    IPOs can be rewarding and risky at the same time. Some do well in the post-listing period; others underperform. Before applying for an IPO, it is crucial to bear in mind the company’s financials, growth prospects, and sectoral trends.

    If you wish, I can prepare this into a blog-ready introduction or merge it with the May 2025 IPO analysis.

    May 2025 IPO Highlights

    1. Prostarm Info Systems Ltd.

    • Sector: Power Solutions & Energy Storage
    • Issue Size: ₹168 crore
    • Price Band: ₹95–₹105 per share
    • Subscription Period: May 27–29
    • Listing: BSE & NSE

    Company Overview: Established in 2008 at Navi Mumbai, Prostarm manufactures power backup solutions comprising UPS systems, inverters, solar hybrid inverters, and lithium-ion battery packs. Project execution of solar rooftops is also another business they undertake on behalf of EPC.

    Financials: Prostarm recorded revenues of ₹257.9 crore in FY24, marking an increase of 12% over the previous year. Net profit grew 18% to ₹22.8 crore. The company has served over 700 clients, including big names such as Larsen & Toubro, Tata Power, and Bajaj Finance.

    IPO Objective: Utilization of issue proceeds shall be for working capital requirements, repayment of debt, strategic acquisitions, and any general corporate purposes required by the company.

    2. Blue Water Logistics Ltd.

    • Sector: Multimodal Transport Services
    • Issue Size: ₹40.5 crore
    • Price Band: ₹132–₹135 per share
    • Subscription Period: May 27–29

    Company Overview: A hallmark logistics provider with freight forwarding, warehousing, and transportation services under one umbrella, Blue Water Logistics aims to upgrade infrastructure and enhance service standards.

    IPO Objective: Proceeds from the IPO will be utilized for the construction of logistics infrastructure, technology platform upgrades, and meeting general corporate expenses.

    3. Nikita Papers Ltd.

    • Sector: Paper Manufacturing
    • Issue Size: ₹67.54 crore
    • Price Band: ₹95–₹104 per share
    • Subscription Period: May 27–29
    • Listing: NSE Emerge

    Company Overview: Nikita Papers is engaged in the manufacturing of Kraft paper, catering to the packaging industry. The company focuses on sustainable and eco-friendly production processes.

    IPO Objective: The capital will be used for capacity expansion, modernization of existing facilities, and working capital requirements.

    4. Aegis Vopak Terminals Ltd.

    • Sector: Oil & Gas Storage
    • Issue Size: ₹2,800 crore
    • Subscription Period: May 26–28
    • Listing Date: June 2

    Company Overview: A joint venture between Aegis Logistics (50.1%) and Netherlands-based Royal Vopak (47.4%), Aegis Vopak Terminals is India’s largest third-party owner and operator of tank storage terminals for LPG and liquid products, with a storage capacity of approximately 1.5 million cubic meters.

    Financials: In FY24, the company reported a revenue of ₹570.12 crore, up 60% from the previous year, and a net profit of ₹86.54 crore, a significant turnaround from a loss in FY23.

    IPO Objective: Proceeds will be utilized for debt repayment, funding capital expenditure for the acquisition of a cryogenic LPG terminal at Mangalore, and general corporate purposes. 

    5. Scoda Tubes Ltd.

    • Sector: Steel Tubes & Pipes
    • Issue Size: ₹275 crore
    • Price Band: ₹130–₹140 per share
    • Subscription Period: May 28–30

    Company Overview: Scoda Tubes specializes in manufacturing stainless steel tubes and pipes, catering to various industries including oil & gas, pharmaceuticals, and construction.

    IPO Objective: The funds will be allocated towards expanding manufacturing capacity, enhancing product quality, and meeting working capital needs.

    6. Belrise Industries Ltd.

    • Sector: Automotive Components
    • Issue Size: ₹2,150 crore
    • Status: SEBI Approval Received

    Company Overview: Belrise Industries manufactures automotive components, including metal chassis systems and suspension components, serving clients like Bajaj Auto, Honda, Hero MotoCorp, and Jaguar Land Rover. The company operates 15 manufacturing facilities across India and exports to markets such as Austria, Slovakia, the UK, Japan, and Thailand.

    Financials: In FY24, the company reported a revenue of ₹7,484.2 crore, a 13.7% increase from the previous year, with a net profit of ₹310.9 crore.

    IPO Objective: The primary aim is to reduce debt by ₹1,618 crore and fund general corporate purposes.

    7. Borana Weaves Ltd.

    • Sector: Textiles
    • Issue Size: 70 lakh equity shares (Fresh Issue)
    • Listing Date: May 27
    • Listing Price: ₹243, a 12.5% premium over IPO price

    Company Overview: Based in Surat, Borana Weaves specializes in the production of unbleached synthetic grey fabric. The company plans to establish a new manufacturing unit to expand its production capabilities.

    Financials: For FY24, the company reported revenue of ₹199 crore and a net profit of ₹23.59 crore.

    IPO Objective: Funds will be used to set up a new manufacturing unit, meet working capital requirements, and for general corporate purposes. 

    Upcoming SME IPOs

    Several SMEs have announced IPOs this month:

    • Astonea Labs: Price Band ₹128–₹135; Subscription May 27–29
    • Neptune Petrochemicals: Price Band ₹115–₹122; Subscription May 28–30
    • NR Vandana Textile: Price Band ₹42–₹45; Subscription May 28–30

     Conclusion

    IPOs are a key way for companies to raise capital and grow, while giving investors an opportunity to invest in promising companies at an early stage. The IPO space was abuzz in May 2025, with companies from sectors like power, logistics, paper, and auto components coming to the markets. This reflects growing investor interest and growing corporate confidence in India’s economic outlook.

    With both large and SME IPOs showing momentum, May was a solid month for public listings—offering opportunities for informed investors and signaling continued strength in the capital markets.

    👉 Enroll today and become a smarter, safer trader.

    Join our free telegram channel
  • A Comprehensive Financial Review of Angel One Ltd

    A Comprehensive Financial Review of Angel One Ltd

    Angel One

    Angel One Ltd. (formerly Angel Broking) has been an established name within the Indian financial services sector. Let us undertake an overview of its recent performance, financial health, and key business segments in accordance with available information.

    Market Performance: A Bullish Trend?

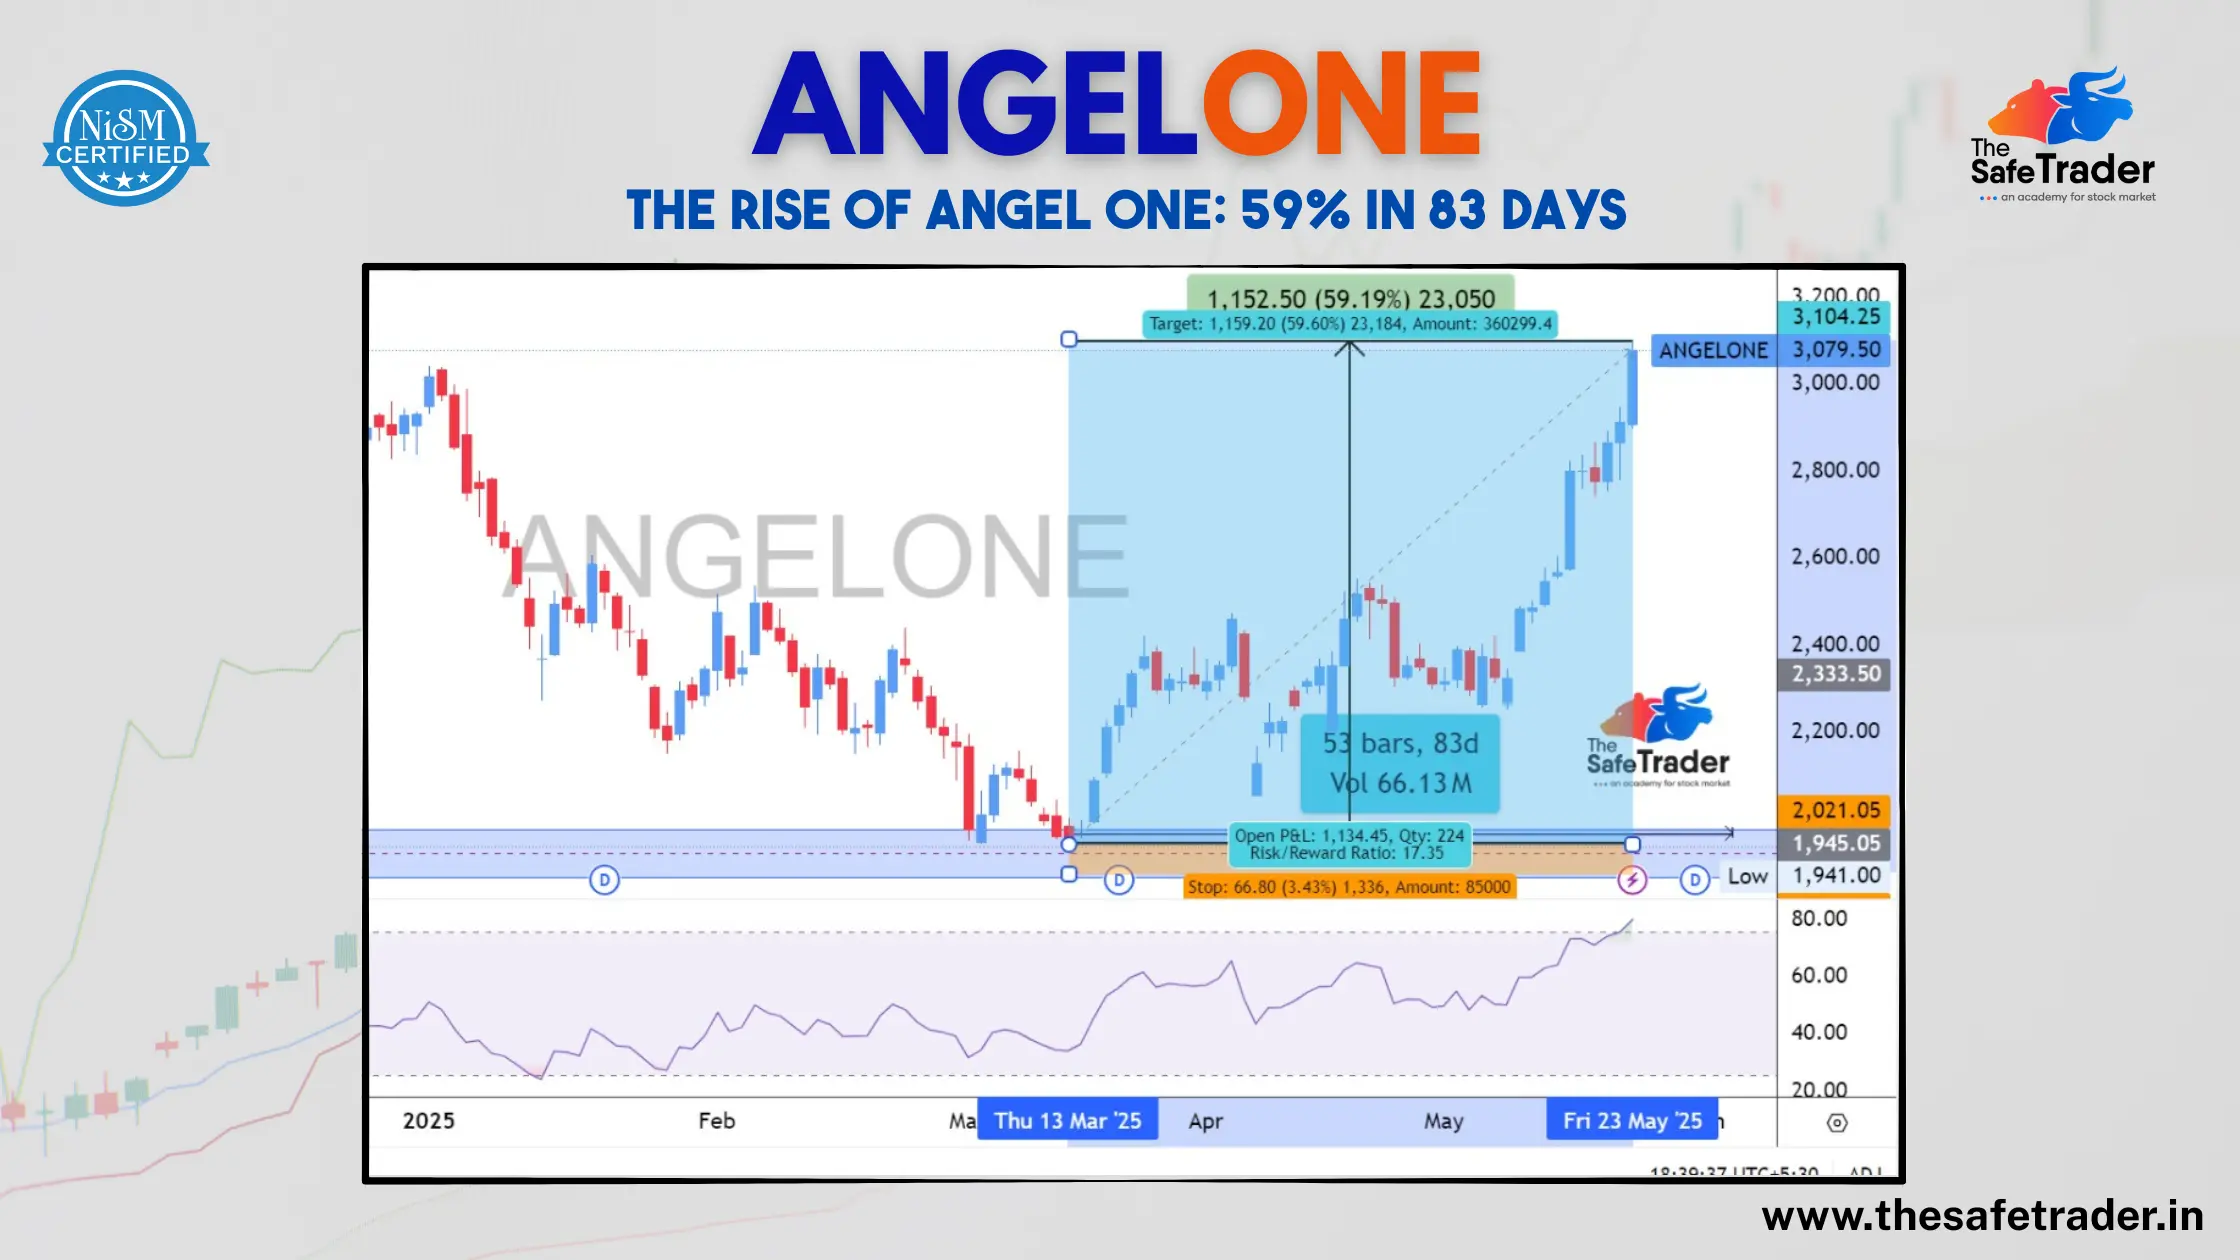
    Angel One Ltd. stock, highlighting a major upward move.

    Strong Uptrend: Around March 2025, the chart showcases a very strong bullish run. The stock moved up from nearly ₹1,941.00 to above ₹3,079.50 as of May 23, 2025.

    Impressive Gains: The highlighted area indicates a potential target of ₹3,152.50, which further converts into a 59.19% gain. The share price is currently near the target.

    Risk/Reward: With respect to the displayed risk/reward ratio of 17.35, this suggests that for every unit of risk taken, the reward being chiseled out is many times larger. These are signals that will attract investors.

    Volume: The trading activity over 53 bars (83 days) closed with a volume at 66.13 million, revealing intense investor interest into this stock over this period.

    Such a technical analysis indicates a positive sentiment over Angel One’s stock with the possibility of further growth in the short to medium terms.

    Company Overview: Broking and Beyond

    Angel One company profile and financial composition.

    Established Player: Founded in 1996, Angel One has a long-standing presence in the financial services industry.

    Market Capitalization: An important factor that gives dimension to Angel One’s stature is its market capitalization of ₹263.38 Billion.

    Key Services: Angel One operates in several segments:

    • Broking & Allied Services: The bulk of this is likely broking, advisory, and product distribution and margin trading.
    • Finance & Investment Activities: Income from financing and investment activities comes within this scope.
    • Health & Allied Fitness Activities: This peculiar service area brings in income for running the fitness centers. Such diversification could hence be a way to tap into different revenue avenues.

    Leadership: CEO is Ambarish Kenghe.

    Ownership Structure: Having 53.37% closely held shares and 46.63% free float shares, the company indicates fairly decent liquidity.

    Dividend Yield & P/E Ratio: The indicative dividend yield is 1.68%, while its P/E (Price to Earnings) ratio is 22.82, which puts its valuation in perspective.

    Financial Performance: A Mixed Bag, but Growth in Key Areas

    Angel One’s revenue, expenses, and profitability over various periods.

    Despite a slight quarterly decline, Angel One has delivered strong annual growth. Let’s dive into the financials:

    Quarterly Data (FY25):

    QuarterRevenueGross ProfitOperating IncomeNet Profit
    Q1 FY25₹15.16B₹11.73B₹6.23B₹4.89B
    Q2 FY25₹12.64B₹9.59B₹3.87B₹2.95B
    Q3 FY25₹14.10B₹10.38B₹4.79B₹3.78B
    Q4 FY25₹10.58B₹8.02B₹2.16B₹1.11B

    Quarterly performance (from Q3 2022 to Q4 2025-projected):

    Total Revenue: Angel One has proven to grow consistently from every quarter on a QoQ basis throughout most of 2023 and 2024. However, the projection for Q4 2025 points toward a dramatic Year-on-Year decline of 22.13% in total revenue, with a corresponding 23.19% fall in gross profit, and this pains careful attention.

    Operating Income: Again, almost similar to revenues and growth, operating incomes have also exhibited dramatic growth throughout most of 2023 and 2024 years, while for Q4 of 2025, a substantial 40.94% decline in operating income is projected on a YoY basis, and this is something to worry about.

    Net Income: Net income was generally on an upward trend but was showing a serious dip in the projected Q4 2025. 

    Details of annual generation (2018-2024):

    Spectacular Growth in Broking: The “Broking and Related Services” segment has undergone exponential YoY growth from ₹4.25 Billion in 2018 to ₹52.48 Billion in 2024, which signifies the perceived strong performance of their core business.

    Finance & Investing Activities: That segment exhibits steady growth; hence, a strong financial and investing arm can be deduced. 

    Health & Allied Fitness Activities: Revenue in this segment has been pretty stable, around ₹50-60 million ranges and is therefore not a core revenue generator.

    Overall Annual Growth:The high overall annual growth in revenues witnessed by Angel One at almost every sector, especially the broking business, is one’s testimony to a growing market distance and client base capacity.

    The projected decline in Q4 2025 revenue and operating income is an important point to monitor and understand. It could be due to various factors such as increased competition, market slowdowns, or a change in business strategy.

    Dividend Payout History: Bearing Gifts for Shareholders

    Consistent Dividends: Angel One has paid dividends consistently to its shareholders and in some cases, more than once a year (interim and final).

    Increasing Payouts: Over the years, the company has witnessed an uptrend in the dividend payout amount, thus reflecting enhanced profitability of the company and its intention to channel some value to the shareholders. The final dividend is projected at ₹26.00 on May 30, 2025, which is quite substantial as compared to some earlier payouts of ₹2.25 in May 2022.

    Conclusion

    Angel One Ltd. has cast a strong spell of growth in the financial service sector with an unassailable market position in its core broking business. The technical chart shows a very good recent market performance, and historical annual revenue figures show a growing trend. The dividend payouts, consistent ones, speak well of an investment.

    The forecast revenues and operating income dip in Q4 2025 calls for further explanation. Understanding the reasons underpinning this forecast dip could be invaluable for assessing the short-term outlook of the company. In the large scheme of things, Angel One appears to be a strong player in the Indian financial market with great growth potential looming ahead, but it will have to look at possible hurdles in the near future.

    👉 Enroll today and become a smarter, safer trader.

    Join our free telegram channel

  • Commodity Trading in India

    Commodity Trading in India

    Commodity Trading

    Commodity trading has become an integral part of India’s financial infrastructure, providing traders with means to hedge risk, diversify portfolios, and capitalize on global market movements. Unlike the stock exchange where shares of companies are traded, commodity trade is concerned with tangible goods like metals, energy, and agricultural produce.

    This guide will walk you through commodity trading, the Indian major exchanges-MCX and NCDEX, and lots of other key points like lot sizes and market timings, which are essential to legion into your successful commodity trading venture in India.

    What is Commodity Trading?

    The practice of trading is buying and selling raw materials or primary goods on spot or derivatives markets (largely futures and options).The broad classification of commodities includes:

    Hard Commodities: Metals, energy (gold, crude oil)

    Soft Commodities: Agricultural products (wheat, cotton)

    Major Commodity Exchanges in India: MCX vs NCDEX

    MCX (Multi Commodity Exchange of India Ltd.)

    Established: 2003

    Headquarters: Mumbai

    Regulator: SEBI

    Focus: Non-agricultural commodities (metals, energy)

    Popular Commodities Traded on MCX:

    Bullion: Gold, Silver

    Energy: Crude Oil, Natural Gas

    Base Metals: Copper, Aluminium, Zinc, Nickel, Lead

    NCDEX (National Commodity & Derivatives Exchange)

    Established: 2003

    Headquarters: Mumbai

    Regulator: SEBI

    Focus: Agricultural Commodities

    Popular Commodities Traded on NCDEX:

    Soybean, Mustard Seed, Chana, Cotton Seed Oil Cake, Turmeric, Jeera, Guar Gum, Barley

    Commodity Segments on MCX & NCDEX

    ExchangeSegmentExamples
    MCXBullionGold, Silver
    Base MetalsCopper, Zinc, Aluminium
    EnergyCrude Oil, Natural Gas
    NCDEXAgricultureWheat, Soybean, Mustard, Turmeric

    Detailed Commodity Segments: Mega, Mini & Micro Contracts on MCX & NCDEX

    Commodity trading offers flexibility in terms of contract sizes to cater to different types of participants—from large institutions to small retail traders. Contracts are typically categorized as Mega, Mini, and Micro based on their lot size and margin requirements.

    Here’s a breakdown of the major traded commodities on MCX and NCDEX with their variants:

    1. Gold (MCX)

    Gold is the most actively traded commodity in India, widely used for investment, jewelry, and as an inflation hedge.

    Contract TypeSymbolLot SizeMargin (Approx.)Use Case
    MegaGOLD1 kg₹2.5–₹3 lakhInstitutional traders
    MiniGOLDM100 gm₹25,000–₹30,000Mid-size traders
    MicroGOLDPETAL1 gm₹200–₹300Small/retail traders
    MicroGOLGUINEA8 gm₹1,800–₹2,500Gold savings, gifting

    Expiry: 5th of every month (or preceding business day)

    2. Silver (MCX)

    Silver is an industrial and investment metal with high volatility and liquidity.

    Contract TypeSymbolLot SizeMargin (Approx.)Use Case
    MegaSILVER30 kg₹1.8–₹2.5 lakhProfessionals/institutions
    MiniSILVERM5 kg₹30,000–₹50,000Retail swing traders
    MicroSILVERMIC1 kg₹6,000–₹10,000Low-cap retail traders

    Expiry: 5th of every month (or preceding business day)

    3. Crude Oil (MCX)

    Crude oil is the lifeblood of the global economy and highly sensitive to geopolitical events.

    Contract TypeSymbolLot SizeMargin (Approx.)Use Case
    MegaCRUDEOIL100 barrels₹2.5–₹3 lakhLarge traders, institutions
    MiniCRUDEOILM10 barrels₹25,000–₹30,000Short-term retail traders

    Expiry: 19th of the month or the preceding business day

    Note: Crude oil is highly volatile—risk management is essential.

    4. Natural Gas (MCX)

    A key energy commodity, used in industrial and household consumption. Priced in mmBtu (Million British Thermal Units).

    Contract TypeSymbolLot SizeMargin (Approx.)Use Case
    StandardNATURALGAS1,250 mmBtu₹50,000–₹75,000Volatility traders
    MiniNATURALGASM250 mmBtu₹10,000–₹15,000Small lot participants

    Expiry: Last business day of the month

     5. Copper (MCX)

    Used heavily in industrial manufacturing, copper prices reflect global industrial health.

    Contract TypeSymbolLot SizeMargin (Approx.)Use Case
    StandardCOPPER1 MT (1000 kg)₹1.5–₹2 lakhHedgers and traders
    MiniCOPPERM250 kg₹35,000–₹50,000Smaller risk appetite

    Expiry: Last business day of the month

    Other Base Metals on MCX

    CommoditySymbolLot SizeRemarks
    ZincZINC5 MTAlso available as ZINCMINI (1 MT)
    AluminiumALUMINIUM5 MTLiquid metal with industrial demand
    LeadLEAD5 MTUsed in batteries
    NickelNICKEL250 kgHigh-value industrial metal

    Select NCDEX Agri Commodities

    Agri commodities do not have “Mini” or “Micro” formats but have standardized lot sizes:

    CommoditySymbolLot SizeSeasonal Impact
    SoybeanSOYBEAN10 MTYes (Monsoon, harvest)
    Mustard SeedRMSEED10 MTYes
    TurmericTURMERIC5 MTYes
    Jeera (Cumin)JEERA3 MTYes
    Chana (Gram)CHANA10 MTYes
    Cotton Seed CakeCOTTONCAK5 MTYes

    Expiry: 20th of the month (or preceding business day)

    Why Mega, Mini, and Micro Contracts Matter?

    Contract TypeBest ForKey Benefit
    MegaInstitutional, HedgersLower transaction cost per unit
    MiniExperienced retail tradersFlexible capital usage
    MicroBeginners, low-cap tradersMinimal risk exposure

    Pro Tip: Mini and Micro contracts are ideal for learning, testing strategies, and reducing exposure during volatile markets.

    Would you like a visual table/infographic to represent this section for your blog? I can prepare one for better engagement and SEO.

    Market Timings

    MCX Market Timings

    • Weekdays: Monday to Friday
      • Morning Session: 9:00 AM – 5:00 PM (Agri Commodities)
      • Evening Session: 5:00 PM – 11:30 PM / 11:55 PM (Metals, Energy)

    NCDEX Market Timings

    • Weekdays: Monday to Friday
      • Agri Commodities: 9:00 AM – 5:00 PM

    Note: Evening session on MCX aligns with global markets like NYMEX and LME.

    Lot Size in Commodity Trading

    Lot size refers to the standardized quantity for each futures contract. Here are a few examples:

    CommodityExchangeLot Size
    GoldMCX1 kg / 100g (Mini)
    SilverMCX30 kg
    Crude OilMCX100 barrels
    CopperMCX1 metric ton
    SoybeanNCDEX10 MT
    Mustard SeedNCDEX10 MT

    Expiry Days of Commodity Contracts

    Futures contracts have a monthly expiry, though some may have weekly or bi-monthly durations.

    • MCX: Last business day of the month
    • NCDEX: Typically 20th day of the month (or preceding working day if it’s a holiday)

    Traders should exit or roll over positions before expiry to avoid physical delivery unless they’re hedgers or institutions.

    Types of Futures Contracts

    • Futures Contracts

    Standardized contracts to buy/sell a specific commodity at a predetermined price in the future.

    • Options on Futures

    Available in select commodities on MCX (e.g., Gold, Crude Oil), offering limited-risk opportunities.

    • Mini and Micro Contracts

    Smaller variants for retail participation—especially in Gold and Silver.

    Commodity Indexes in India

    Commodity indexes track price movements across a basket of commodities.

    MCX iCOMDEX Series:

    • Bullion Index: Gold & Silver
    • Base Metal Index: Copper, Zinc, Nickel, Lead, Aluminium
    • Energy Index: Crude Oil, Natural Gas

    These indexes are used to track performance and may form the basis of index-based products.

    Advantages of Commodity Trading

    • Diversification: Moves independently from equity/bond markets.
    • Hedging: Farmers, importers/exporters, and corporations hedge against price risks.
    • Leverage: Trade large contracts with lower margin requirements.
    • High Liquidity: Especially in commodities like Gold and Crude Oil.
    • Global Exposure: Reacts to international events, allowing for macro-based trading.

    Best Time to Trade Commodities

    • MCX Metals & Energy: 6 PM – 11:30 PM (Aligns with NYMEX/LME)
    • NCDEX Agri Commodities: 9 AM – 12 PM (Higher domestic participation)
    • Avoid trading during low-volume lunch hours (1 PM – 2 PM) or at expiry due to volatility.

    Factors Impacting Commodity Markets

    • Global Demand & Supply: Major influence on pricing.
    • Geopolitical Events: Conflicts or sanctions impact oil, gold.
    • Currency Movements: USD strength/weakness affects international commodity prices.
    • Weather Conditions: Monsoons, droughts impact agri prices.
    • Government Policy: Export bans, MSP, taxes, and subsidies.
    • Inventory Reports: EIA (Energy), LME (Metals), FCI (Food grains)

    How Are Commodity Markets Different from Equity Markets?

    FeatureCommodity TradingEquity Trading
    AssetPhysical goods (oil, gold, wheat)Shares of companies
    Contract TypeFutures (and options)Cash & Derivatives
    ExpiryYes, monthlyOnly in derivatives
    Trading HoursUp to 11:55 PM (MCX)9:15 AM – 3:30 PM
    Hedging UseHigh (for businesses, farmers)Low
    Global LinkageStrong (NYMEX, LME, CBOT)Moderate
    VolatilityHigh due to macro/geopolitical factorsDepends on company performance
    Delivery OptionMostly avoided unless hedgingUsed in delivery-based trades

    Conclusion

    In India, commodity trading through MCX and NCDEX provides an exhilarating opportunity for retail as well as for institutional investing. Given their strong linkage with global phenomena, long trading hours, and a thousand instruments (ranging from bullion to agri), commodities provide for diversification and strategic hedging. Because it is leveraged and volatile, therefore, and hence must be studied with the utmost discipline and rigor, a commodity market is not for speculation.

    The commodity markets are great tools if used well by the farmers who want to protect their harvest from any distressed commodity price or by the trader who wants to earn out of global trends in commodity prices.

    👉 Enroll today and become a smarter, safer trader.

    Join our Telegram Channel