Thesafetrader

Author: thesafetrader.in

  • Derivatives – Futures and Options Trading

    Derivatives – Futures and Options Trading

    Derivatives

    Introduction

    In derivatives trading, stock price changes are profit-making opportunities for the investors without them ever physically owning the stocks. It is a market that provides itself to risk management or making quick bucks. As of March 2025, the National Stock Exchange (NSE) contains 217 stocks in the Futures and Options (F&O) list. This proliferation manifests the growing importance of derivatives in the Indian market. Understanding futures and options is the key for traders and investors to survive in this highly competitive environment. The market activities are heavily regulated by SEBI, which promotes fair trading and transparency.

    Understanding Derivatives: An Introduction

    What Are Derivatives?

    Derivatives are financial contracts whose value varies with the price of some other asset, such as stocks. They are used either to protect investments or to make profits by betting on price moves. The principal types are futures, options, and swaps. These help traders to avoid risks or speculate on price changes without taking ownership of the actual asset. 

    The Role of SEBI in Derivatives Trading

    SEBI, the Securities and Exchange Board of India, is the regulator for all derivatives trades. It formulates rules and regulations to keep the market safe and transparent. SEBI, in 2025, gave new directions for making the market more stable and less subject to manipulation while also protecting investors. These included tightening margin and trading limits.

    Benefits of Trading Futures and Options

    Futures and options offer many advantages to investors. They protect against losses(i.e., hedging). Speculators use futures and options to increase profits from small initial investments. Other derivatives help the discovery of fair stock prices and add transparency to the market.

    Exploring Different Types of Futures Contracts

    In the Indian financial markets, futures contracts are available across multiple asset classes — stocks, indices, commodities, and currencies. Understanding each type is crucial for traders and investors looking to diversify their strategies.

    Stock Futures Standardized: a contract between the two persons in which they determine the specific quantity of the stock to buy or sell at the predetermined future date for a particular price. 

    At present, March 2025, 217 of the stocks in the Indian stock market are recognized for trading in F&O in NSE. This is further classified into different sectors, for example, banking, IT, automobiles, pharmaceutical sectors, etc.

    Example Companies Available for Stock Futures Trading:

    Company NameNSE SymbolSector
    Reliance Industries LimitedRELIANCEEnergy/Conglomerate
    Infosys LimitedINFYInformation Technology
    HDFC Bank LimitedHDFCBANKBanking
    Tata Consultancy ServicesTCSInformation Technology
    ICICI Bank LimitedICICIBANKBanking
    Bharti Airtel LimitedBHARTIARTLTelecom
    Larsen & Toubro LimitedLTEngineering & Construction
    Bajaj Finance LimitedBAJFINANCENBFC (Financial Services)

    Key Features:

     Lot Size: Like all stock futures, all stocks have a defined lot size. For example, Reliance has 250 in the lot size where 250 shares constitute one lot.

    Margin Requirement: The trader must pay the initial margin amount which is generally 20-25% of the entire value of contract in trade. 

    Settlement: Cash-settled on expiry of contract, which means no delivery of shares.

    📌Stock Futures serves the purpose of Hedging towards individual stock positions or leveraged exposure into stock movement.

    2. Index Futures

    Contracts based on an index rather than individual stocks are called index futures. These contracts provide wider market exposure with highly liquidity.

    Popular Index Futures on NSE:

    Index NameDescription
      
    NIFTY 50India’s flagship index comprising 50 major companies across sectors.
    BANKNIFTYCovers 12 of the most liquid and large-cap banking stocks.
    FINNIFTYRepresents the diversified financial services sector (banks, NBFCs, insurance).
    MIDCPNIFTYFocuses on mid-cap companies.

    Popular Index Futures on BSE:

    Index FutureDescription
    S&P BSE SENSEX FuturesFutures contract based on BSE’s 30 largest and most traded stocks.
    S&P BSE BANKEX FuturesFutures contract tracking major banking sector companies on BSE.
    S&P BSE SENSEX 50 FuturesFutures based on the top 50 companies listed on the BSE exchange.
    S&P BSE Bharat 22 Index FuturesFutures based on a diversified basket of 22 Public Sector Enterprises (PSEs).
    S&P BSE 100 FuturesFutures tracking the top 100 listed companies for broader market exposure.

    Key Features:

    Diversification: One index future represents a portfolio of stocks.

    Low Volatility: Compared to single stocks.

    Cash Settlement: No delivery of stocks at expiry — cash-settled based on index closing value.

    📌 Index Futures work best for traders having a view on the general market or sector movement rather than on particular companies.

    3. Commodity Futures

    Commodity Futures allow trading in essential goods like metals, energy products, and agricultural produce. In India, commodity futures are primarily traded on the Multi Commodity Exchange (MCX).

    Major Commodity Futures:

    CommodityDescription
    GOLDA traditional safe-haven asset, ideal during economic uncertainty.
    SILVERIndustrial and investment demand makes silver highly volatile.
    ZINCWidely used for galvanizing steel to prevent corrosion.
    COPPEREssential for construction, electronics, and manufacturing industries.
    CRUDE OILVital for the global economy; sensitive to geopolitical events.

    Key Features:

    • Leverage: Trade large quantities with smaller capital.
    • Physical Delivery or Cash Settlement: Depending on the contract.
    • Diversification: Protect portfolios against inflation and economic cycles.

    📌 Commodity Futures are useful for both hedging and speculation based on global supply-demand dynamics.

    4. Currency Futures

    Currency Futures help traders hedge against currency risk or speculate on forex movements. These are traded on platforms like the NSE and BSE in India.

    Popular Currency Futures Pairs:

    Currency PairDescription
    USDINRU.S. Dollar against Indian Rupee.
    EURINREuro against Indian Rupee.
    JPYINRJapanese Yen against Indian Rupee.
    GBPINRBritish Pound against Indian Rupee.

    Key Features:

    • Contract Size: Fixed for each pair (e.g., USDINR contract is usually $1,000).
    • Settlement: Cash settled based on the RBI reference rate.
    • Low Cost: Transaction costs are minimal compared to the forex spot market.
    • Liquidity: USDINR contracts are especially liquid, with active daily trading.

    📌 Currency Futures are essential for exporters, importers, and global investors managing foreign exchange risks.

    Options Trading: Deep Dive

    What Are Options and Types of Them

    Options give traders the right but not the obligation to buy or sell an underlying stock at a specific price before expiration. 

    • Call options allow the buyer to buy stock. 
    • Put options enable one to sell the stock. 

    Options can either be exercised before expiry for example, American options, or at expiry only for example, European options. 

    How Options Trading Operates

    • Premium: The price paid for an option. 
    • Strike price: Price at which you can buy/sell. 
    • Expiration date: Last day to exercise. 

    Options can either be in-the-money (making money), at-the-money, or out-of-the-money. 

    Pros and Cons of Options Trading 

    They can be used to hedge or speculate. The losses will never exceed the premium paid. However, there is a risk of losing the premium if the market moves against the position for which options have been bought and returns can be adversely affected with high market volatility. 

    Key success data for Options Market: 2025 

    In March 2025, there will be many stocks with options available in the market, high liquidity levels, and open interest in them. Some trends are pointing at rising implied volatility in sectors such as Technology and Pharmaceuticals, which suggests a higher level of caution by investors and opportunities.

    Market Regulation and Integrity 

    Role and Recent New Rules of SEBI 

    To imbue transparency, SEBI has come up with new rules regarding margin norms and position limits. Reporting and disclosures tend to be contributory towards ensuring safer markets for all participants.

    Ensuring Market Safety

    Trades are guaranteed by the NSE clearing corporation to reduce risk. Surveillance tools and strong penalties make the anti-manipulation measures effective. Investor education programs encourage traders to comprehend risks and scamming systems to be avoided.

    Impact on Traders and Investors

    Regulations define how traders formulate their strategies. Knowing the regulations helps in avoiding penalties and loss according to best practices with information for increased safety while trading. 

    Practical Tips for Trading Derivatives on NSE in 2025

    • Research well and analyze charts before trading. 
    • Stop-loss orders should save you if there is no further way out. 
    • Carefully manage your leverage; do not overdid it. 
    • Keeping updated with SEBI notifications and market news. 
    • Practice trading virtual money initially before implementing your strategies. 

    Conclusion

    There is an understanding of futures and options for every trader on the NSE. The current scenario of changing markets and new listings acts as the doorway for most people, therefore careful planning is even more essential. Keep abreast of market regulation and mechanics- best chance of making it into success. There’s scope for growth in derivatives, but consistently discipline and research make it always better. Use the sound infrastructure of the NSE to develop an intelligent investment strategy to benefit from the dynamic Indian markets.

    To Know More Details , Please Click Here

    Join our free telegram channel


  • Power of Asset Classes in Building Your Financial Future

    Power of Asset Classes in Building Your Financial Future

     Asset Classes

    An Asset Class in the Indian stock market (and in general investing) means a group of investments that behave similarly. Each asset class has its own risk and return profile. When people invest, they usually diversify across asset classes to balance risk.

    In the Indian context, the major asset classes are:

    1. Equity (Stocks) 

    • It refers to the ownership in a company.
    • Examples include the Shares of companies like Reliance, TCS, Infosys. 
    • High risk, possibly higher returns. 

    2. Debt (Fixed Income Instruments) 

    • It has government bonds, corporate bonds, debentures. 
    • Less risk involved than equities and fixed returns. 
    • Examples: Government Securities (G-Secs), NCDs (Non-Convertible Debentures). 

    3. Mutual Funds: 

    • Mutual fund is a pooled investment vehicle managed by professionals. 
    • It can invest in equity, debt, or hybrid (mix of both) investments. 
    • It’s perfect for retail investors who prefer diversification.

     4. Derivatives:

    • Financial contracts built on stocks, indices, or commodities, based on some underlying assets.
    • It involves Futures and Options.
    • Highly often used for Hedging or Speculation-high risk. 

    5. Commodities:

    • Tradeable physical goods; goods that range from gold, silver, crude oil, and other agricultural products. 
    • These commodities are usually traded through MCX (Multi Commodity Exchange) and NCDEX. 
    • Helps diversify portfolio against purely financial instruments. 

    6. Real Estate Investment Trusts (REITs):

    • Provides an opportunity for small retail investors to invest in income-generating real estate. 
    • Listed on stock exchanges.
    • For example, Embassy Office Parks REIT. 

    7. Infrastructure Investment Trusts (InvITs) : 

    • The InvITs are similar to REITs but focused on infrastructure projects like highways, power transmission, etc. 
    • It offers regular income along with capital appreciation. 

    8. Exchange-Traded Funds (ETFs) : 

    • Such indices include Nifty or Sensex, commodities, or sectors. 
    • They can be traded by public stock exchanges. 
    • Its low-cost passive investment vehicles.

    9. Currency: 

    • Market (Forex) Trading of currencies through pairs such as USD/INR, EUR/INR on the exchanges like, NSE and BSE.

    Asset Classes With Examples

    Conclusion

    Understanding the different asset classes helps you build a stronger, more balanced portfolio. Stocks, bonds, real estate, commodities, and alternatives each serve unique purposes. Your best strategy involves mixing them according to your goals and comfort with risk. Keep reviewing your investments regularly to stay aligned with market trends and your financial situation. Smart diversifying isn’t just a buzzword—it’s your ticket to better long-term success.

    For More Details, Click Here

    Join Our free Telegram Channel


  • BSE SURGES 80% IN 45 DAYS

    BSE SURGES 80% IN 45 DAYS

    BSE surges 80% in 45 days

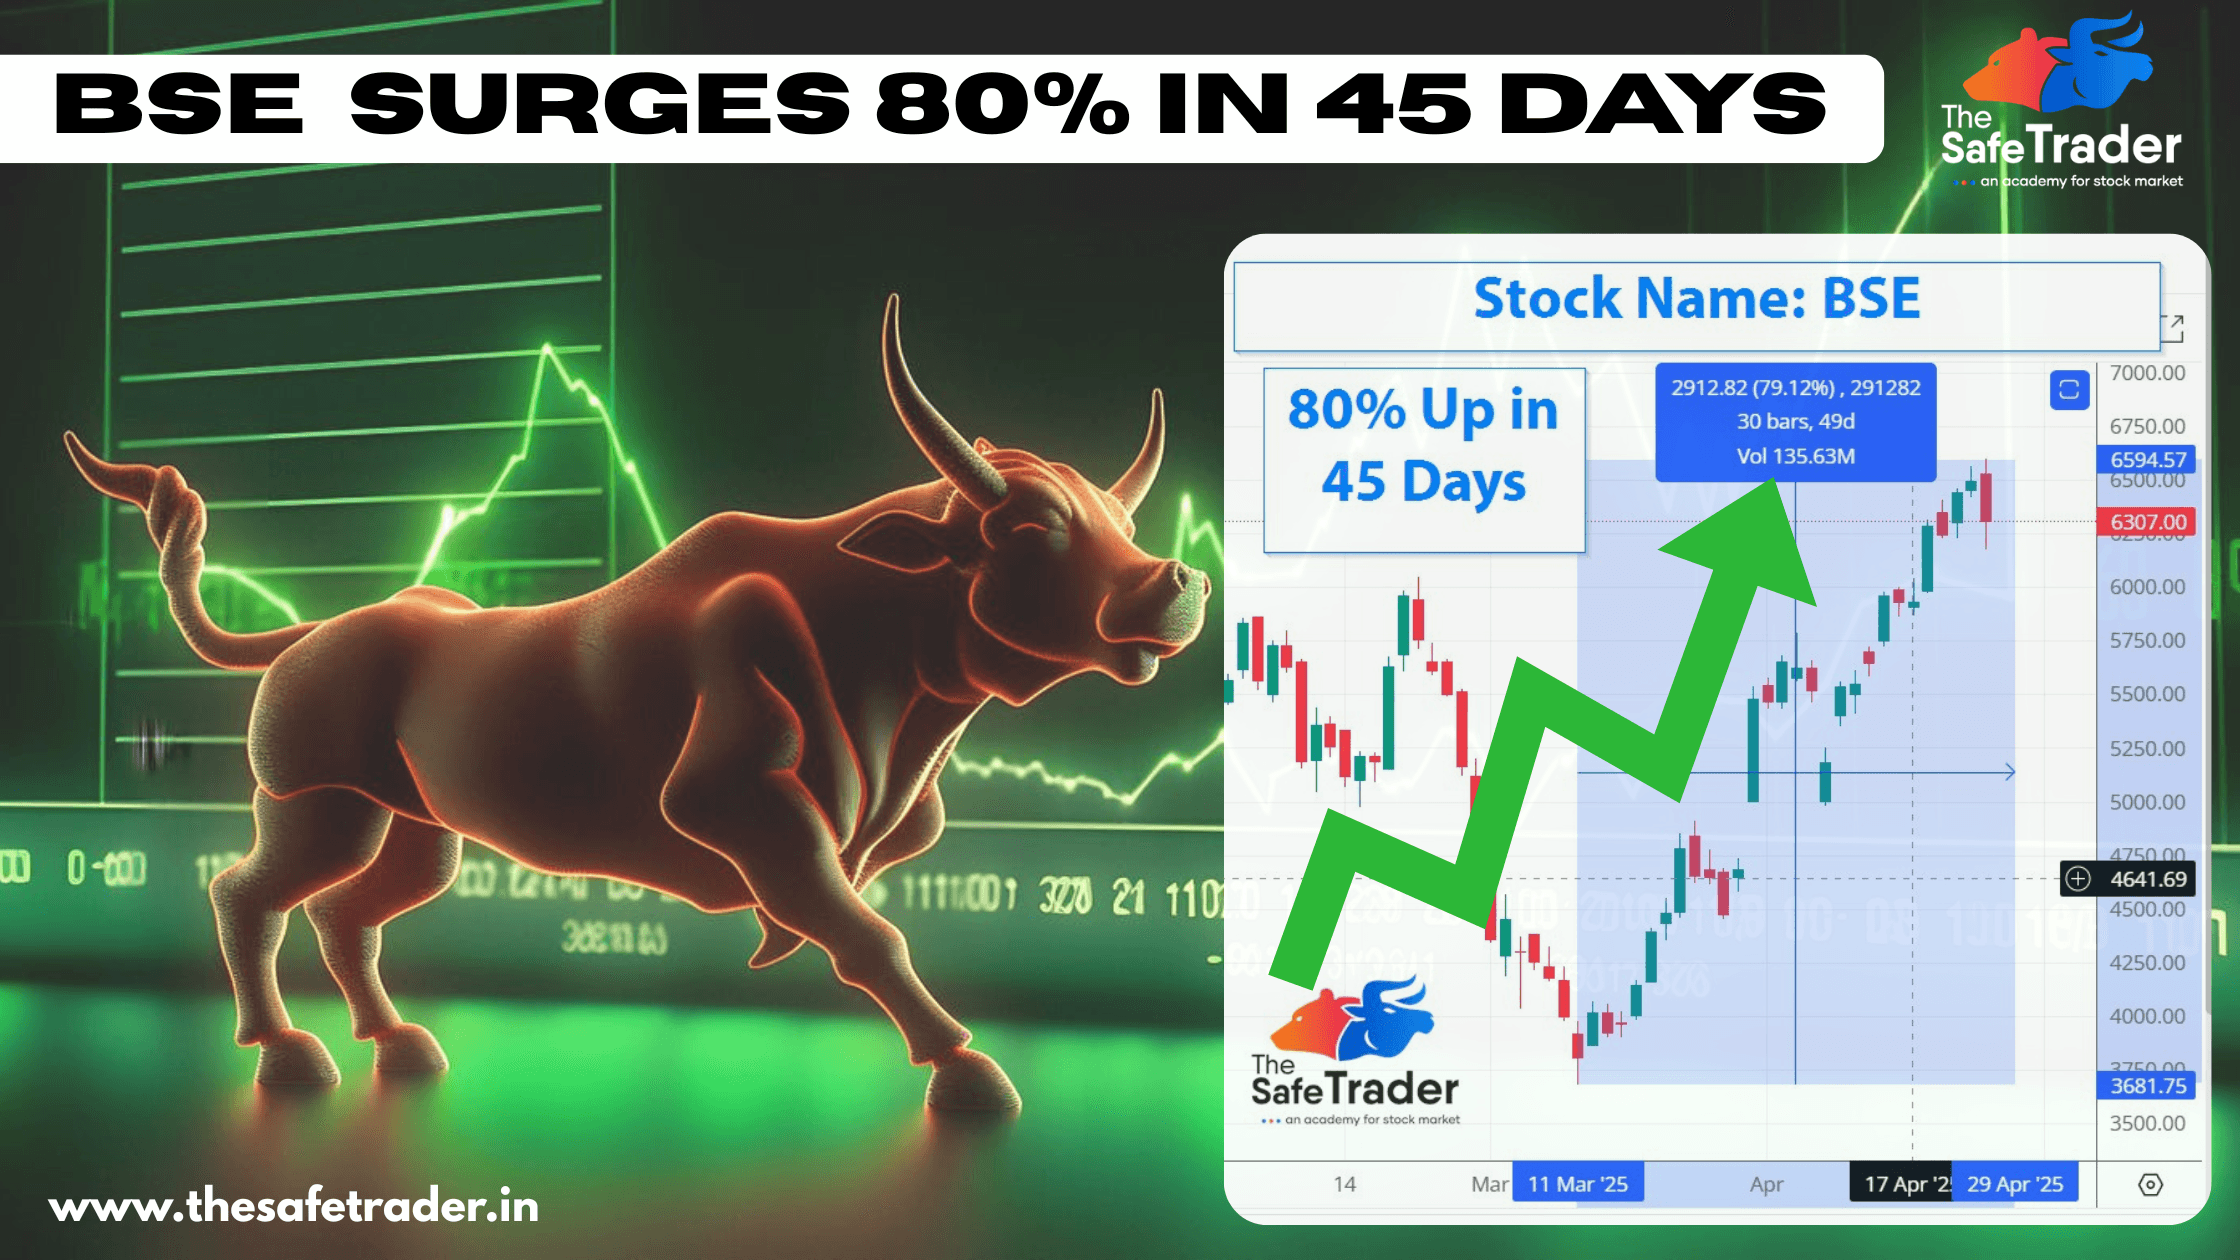
    In a remarkable turn of events, BSE Ltd., Asia’s oldest stock exchange, has witnessed an impressive 80% surge in its stock price over the past 45 days. This significant uptick has caught the attention of investors and market analysts alike.​

    About BSE Ltd :

    Established in 1875, BSE Ltd. (formerly Bombay Stock Exchange) is a premier stock exchange in India. Beyond facilitating equity trading, BSE offers services in derivatives, mutual funds, and SME platforms, playing a pivotal role in India’s financial ecosystem.​

    Recent Stock Performance

    • Current Price (April 25, 2025): ₹4,178.30
    • Price 45 Days Ago (March 11, 2025): ₹2,321.28
    • Percentage Increase: Approximately 80%​

    This surge is particularly noteworthy given the broader market dynamics and BSE’s historical performance.​

    Factors Behind the 80% Rally

    The stock of BSE Ltd. has shown commendable performance on all counts due to the following factors:

    1. Record High Trading Volumes

    Increase in participation in the Indian stock market; more retail investors in the fray. Increase in trading volume directly benefited BSE through transaction fees. 

    2. Growth in Derivatives Segment

    BSE’s strategic focus on expanding derivatives offerings, especially index options and futures, is starting to pay dividends as it attracts an even wider investor base. 

    3. Success of the SME Platform

    The BSE SME platform has become a preferred choice for small and medium enterprises that run after acquiring public listings. This would have brought in extra revenue for the settlement. 

    4. Technological Advancements

    Investment in technology has certainly benefited BSE in enhancing trading infrastructure providing speed with reliability, which drew due participants. 

    5. Positive Market Sentiment

    General bullish sentiment prevailing in the Indian equity markets has continued to spill over into stocks with a focus on financial infrastructure, making BSE Ltd. richer by value. ​

    Stock Performance Snapshots

    BSE Ltd. stock has gained about 80% till April 25, 2025, in the last 45 days. The appreciation reflects the fundamentals of the company and development perception of the investors on the financial sector in India. 

    Investment Considerations

    With the recent rally showing strong legs, potential investors should consider the following: 

    Valuation Metrics: Assess if the current stock price reflects the company’s earnings growth prospects.

    Market Competition: Understand BSE-specific competition issues relative to the National Stock Exchange (NSE).

    Regulatory Environment: Check for any regulatory changes that may impact the exchange operation.

    Technological Disruption: Follow technologies to watch out for that may disrupt trading platforms or affect investor behaviour. 

    Conclusion

    The BSE Ltd. 80% appreciation in 45 days underscores the volatility of the Indian financial markets and the pivotal role of the exchange therein. While the prospects seem bright, the investor should conduct proper due diligence, considering both the opportunity and possible risks attached to a rapid surge in price. ​

    Join Our Free Telegram Channel
  • Stock Analysis – Overvalued, Undervalued, and Fairly Valued Stocks

    Stock Analysis – Overvalued, Undervalued, and Fairly Valued Stocks

    Stock Analysis

    If you’ve ever thought about investing in the stock market, you’ve probably heard the term stock analysis. It sounds technical, maybe even intimidating—but it doesn’t have to be. In fact, learning how to analyze stocks is one of the smartest moves any investor can make.

    What is Stock Analysis?

    Stock analysis is described as the process by which the earnings, management ability, and performance of a company are taken into consideration to determine whether it would be a good investment proposition. Each analysis project sets out to find out if the stock is 

    • Overvalued (priced too high)
    • Undervalued (priced too low)
    • Fairly priced (priced just about right)

    In general, there are two major forms of stock analysis:

    1. Fundamental Analysis

    This type aims mainly at the study of financial statements, business model, industry, and economic front of the company. The question is whether this is a strong company to consider investing in for the long haul. 

    2. Technical Analysis 

    This form analyzes price changes, trading volume, and formations on various charts. It’s more of a question of timing; you want the entry and exit points of your transactions to follow the prevailing trend of the marketplace. 

    What is an Overvalued Stock?

    A stock is said to be overvalued if the share price exceeds the intrinsic value, which is justifiable only by certain fundamental factors such as earnings, revenue, or growth prospects. This situation may have arisen due to speculation, hype, or simply unreasonably optimistic expectations from investors.

    Overvaluation can be defined simply as a price higher than a value derived for the company valuation, and this may inject uncertainty into the situation if the share price adjusts with time to reflect its actual value.

    How to Analyze Overvalued Stocks:

    This is how one can detect and assess a stock is overvalued, through real data-driven analysis:

    1. Look at P/E Ratio (Price-to-Earnings)

    Formula:

    P/E = Share price ÷ Earnings per share

    The high P/E means the market expects a lot of future growth.

    But when growth doesn’t happen, the stock collapses.

    Example:

    If a company had a P/E of 100, it means investors pay 100 dollars for every dollar earned currently. That is a steep bet.

    2. Check the PEG Ratio (Price/Earnings to Growth)

    Formula:

    PEG = (P/E) ÷ Annual EPS Growth Rate

    A PEG over 1.0 often signals overvaluation.

    Example:

    If a stock has a P/E of 60 and expected growth of 20%, the PEG is 3. That’s considered overpriced.

    3. Compare Price-to-Book (P/B) and Price-to-Sales (P/S)

    This is how much a shareholder pays on an average for a possible future payback on the company’s assets and sales. High P/B = paying more than the company’s asset value while high P/S = paying more than the company earns in revenue. Value investing usually goes for lower figures. Unless in a very high-growth industry.

    4. Track Revenue and Earnings Growth

    Look at past performance and forward guidance.

    Warning signs:

    • Flat or Declining Revenue
    • Inconsistent Earnings
    • Cautious Guidance but Climbing Prices

    5. Insider Trading Scenario 

    Selling major blocks of a company’s stock by insiders is really worth checking out because it may mean that they think there is something unmanageable about the current price.

    Intelligent Money Advice: Use tools like Yahoo Finance, OpenInsider, or Finviz to track insider actions.

    6. Compare with Industry Peers: 

    Is the company an outlier with its valuation? 

    Example: If a streaming company has a P/E of 90 while comparison companies at 20-30, demand a reason why. 

    7. Discounted Cash Flow (DCF) Analysis: 

    This is the gold standard to determine how true the price of a stock really is. It forecasts cash flows into the future and discounts them to the amount today. 

    If the stock trades far higher than your DCF estimate, it is probably overvalued.

    What is an Undervalued Stock? 

    An Undervalued Stock, it is defined as a stock that is considered to trade at lower than its intrinsic value; in other words, a value below that which the market feels is correct. 

    So Why does it Happen? 

    • Panic selloffs or bind headlines 
    • Short-term setbacks 
    • Overreactions of the market 
    • Underneath the prow of trendier stocks.

    How to Analyze Undervalued Stocks (Step-by-Step)

    1. Compare PE with Industry Average

    The formula is

    P/E = Share Price/Earnings Per Share (EPS)

    If the P/E ratio is lower than average, it might be undervalued.

    But check whether earnings are stable or growing. 

    For example: A company having a P/E of 9 and its industry average is 18 can be seen as undervalued, but only if the fundamentals are strong. 

    2. Look at the PEG Ratio

    Formula: 

    PEG = P/E divided by Expected Earnings Growth 

    A PEG smaller than 1.0 is generally an indication of undervaluation.

    A cheap stock in relation to its expected growth.

    3. Check the Price-to-Book (P/B) Ratio

    Formula: 

    P/B = Share Price ÷ Book Value per Share 

    When the P/B ratio is less than 1, you’re spending less than the company’s net asset value.

    You can find it especially useful for banks or real estate companies.

    A company with a book value of $20 per share has a market trade price of $15. There you can get notice of a possible bargain.

     4. Study the Price-to-Sales (P/S) Ratio

    Formula: 

    P/S = Market Cap ÷ Revenue 

    A low P/S ratio (generally less than 1) suggests that such stock prices have an undervalued nature. 

    This comes into play when a company shows above-average sales performance but poor short-term profits due to high one-time expenditures.

    5. Analyze Free Cash Flow

    Free Cash Flow (FCF) refers to the extra cash generated by a company after all the expenses have been paid off.

    High performance in FCF implies that a company can do

    • Reinvestment for growth
    • Declare dividends
    • Repurchase shares

    To invest at a low price with positive FCF, well, this can be a good mix for sure. 

     6. Look for Temporary Problems

    Most common temporary problems for undermine stock:

    • Missed earnings report 
    • Regulatory issues  
    • Economic winds against 

    The key question is, short-term hick-up or long-term problems? 

    Assuming the business fundamentals remain firm, it could be just a small dip hence a great buy. 

     7. Use Discounted Cash Flow (DCF) Analysis

    It is a very advanced but powerful technique employing forecasting of future cash flows to evaluate the actual worth of a stock. 

    If the market price is much less than your value DCF valuation, you have a potential undervalued stock. 

    Use tools like Simply Wall St, Finbox, or Morningstar to run your DCF calculations.

    What Are Fairly Valued Stocks?

    If you’ve been researching stocks, you’ve probably heard the terms undervalued and overvalued tossed around like confetti. But what about the middle ground?

    Welcome to the world of fairly valued stocks—where a stock’s market price aligns with its true, intrinsic value. No hype, no discount, just solid fundamentals and realistic pricing.

    Valuation of Stocks

    A fair valuation does not imply that the stock is uninteresting, just that the market is pricing in the stock based on all the known information. Here are some means of assessing fairly valued stocks:

    1. P/E Ratio Versus Industry Average

    If the P/E (Price-to-Earnings) ratio is roughly in line with its industry sector’s average and the company has been performing quite consistently, it is quite possibly fairly valued.

    Example:

    If a certain tech company is trading at P/E 22 while the industry average is perched around 21-23, it seems likely that they are just right.

    2. PEG Ratio Adjustment

    PEG Ratio = P/E ÷ Growth Rate of Earnings

    When the ratio hovers around 1.0, it usually indicates fair value considering growth.

    If the PEG Ratio is below 1, it may reflect undervaluation, and anything above 1.5 would lean toward overvaluation.

    3. Discounted Cash Flow (DCF) Estimate ≈ Market Price

    When your DCF valuation of the company is in line with the current stock price, indication becomes strong that the market is fairly pricing the company’s future cash flow.

    4. Price-to-Book (P/B) and Price-to-Sales (P/S) Ratios Should Remain Stable

    The stock under inspection is more likely to be fairly valued if these ratios adhere to historical averages and peer companies’ comparisons.

    5. Absence of Major Red Flags or Unexpected Growth Surprises

    If the company is widely known to be

    • Stable in earnings
    • Consistent in performance
    • Not an arena for shocking news or speculative spikes

    …these certainly suggest the stock is probably trading somewhat near real value.

     Which Type Should You Invest In?

    Each stock category offers different opportunities based on your strategy:

    Final Words

    Identifying whether a stock is overvalued, undervalued, or fairly valued is the secret weapon of every successful investor.
    It allows you to enter at the right time, manage risk smartly, and maximize profits.

    ✅ Undervalued stocks = Bargains for long-term growth.
    ✅ Overvalued stocks = Dangerous if entered late.
    ✅ Fairly valued stocks = Stability and consistent wealth building.

    Join Our Free Telegram Channel
  • Risk Reward Ratio in the Stock Market

    Risk Reward Ratio in the Stock Market

    Risk Reward Ratio

    Probably the key concept that an investor or trader needs to comprehend is the Risk-Reward Ratio (RRR). This method can either make or break an investor, whether he has been in the business for years or just entering it. One really knows the RRR to sway his success and decision-making in the financial markets.

    What Is the Risk-Reward Ratio?

    The risk-reward ratio (RRR) is a measure that compares the potential profit of a trade to the potential loss. It helps investors and traders evaluate whether a trade is worth taking.

    Formula:

    For example, if you are willing to risk $100 for a potential profit of $300, the risk-reward ratio is:

    This means for every dollar you risk, you stand to gain three.

    Why Is It Important?

    1. Improved Trading Analysis – You can evaluate a trade worthy of the risk before you enter it.
    2. Discipline Improvements: It will keep your emotions in check and allow you to trade on logic and planning.
    1. Profits from Losses: A good Risk Reward Ratio will keep you profitable, even with a win rate below 50%. For instance, if you have a 1:3 RRR and only win 3 trades out of 10, you could still break even or show profit.

    How Indian Traders Use the Risk Reward Ratio

    Let’s take a real-world-style example from the Indian markets:

    • Entry Price: ₹500
    • Target Price: ₹650
    • Stop-Loss Price: ₹450

    Risk = ₹500 – ₹450 = ₹50
    Reward = ₹650 – ₹500 = ₹150

    You’re risking ₹50 for the chance to make ₹150. This is generally considered a favorable setup.

    Common Mistakes Made by Indian Investors

    1. They fall for tips or get affected by the fear of missing out without being able to assess the risk: A hasty decision would be to invest without a proper risk assessment.
    2. Ignoring stop-losses: A long holding period can burn the gains.
    3. Overvaluing potential reward: Have some commonsense and exercise technical/fundamental analysis.
    4. Adapting slowly to changing market conditions: Strategies that worked in the bull phase might not work in the corrective phase.

    What’s a Good Risk-Reward Ratio?

    Most experienced Indian traders aim for a minimum of 1:2 or 1:3 in their trades. A 1:2 ratio means you stand to gain ₹2 for every ₹1 you risk. The higher the ratio, the more cushion you have for losses.

    Risk Reward Ratio

    Tips to Use Risk Reward Ratio Effectively

    • Use Stop-Loss Orders: Always protect your capital by setting a stop-loss.
    • Don’t Trade Emotionally: Stick to your plan. Avoid shifting your stop-loss or target once you enter a trade.
    • Combine with Win Rate: Even with a low win rate, a good RRR can keep your portfolio in the green.

    Final Thoughts

    The risk-reward ratio is a foundational principle of successful trading. It helps you think in terms of probabilities and manage risk like a pro. Whether you’re investing in Nifty 50 stocks, mid-caps, or even F&O, understanding and applying RRR can significantly improve your long-term success.

    Join Our Free Telegram Channel
  • All About Altcoins: What You Need to Know

    All About Altcoins: What You Need to Know

    Altcoins

    Altcoins, or alternative cryptocurrencies, were introduced after Bitcoin to address its limitations and offer diverse functionalities. They include popular options like Ethereum, Litecoin, and Ripple, each catering to different use cases. Altcoins provide investors with various opportunities in the rapidly growing cryptocurrency market.

    What is Altcoin?

    The term “altcoin” is derived from “alternative” and “coin,” referring to any cryptocurrency other than Bitcoin. Whereas Bitcoin was the first cryptocurrency in order of creation, other developers were making new projects after Bitcoin’s establishment to improve on its faults and add new functionalities. These are now generally known as the altcoins.

    Altcoins are called so because they usually serve one or more of the following purposes: speed transaction, enhance privacy, and support decentralized apps.

    A Quick History of Altcoins:


    In 2009, the pseudonymous inventor of Bitcoin, Satoshi Nakamoto, introduced the concept of decentralized digital currency to the world. Soon, however, as the limitations of Bitcoin became evident-such as slow transaction speeds and high energy consumption-developers began to devise competing alternatives.

    The first significant altcoin was Namecoin, launched in 2011; followed by Litecoin, known as “silver to Bitcoin’s gold,” and Ripple (XRP). Each new altcoin sought to remedy or add something that Bitcoin lacked-whether speed, privacy, or functionality.

    Since then, the world has exploded in hundreds of thousands of cryptocurrencies and the growth continues day by day.

    What Makes Altcoins Different from Bitcoin?

    Altcoins differ from Bitcoin in several crucial aspects, even though they all use blockchain technology to exist.

    Purpose: Some are intended to allow for smart contracts (such as Ethereum), others to facilitate quick payments (like Dash or Litecoin), while some further enable specific decentralized apps.

    Technology: Different consensus algorithms (such as Proof of Stake rather than Proof of Work) are employed by many altcoins to achieve faster speeds or lowered energy consumption.

    Governance: Many more recent altcoins give their holders the right to vote on alterations to the network because this is not directly done in Bitcoin.

    Types of Altcoins

    In general, altcoins can be classified into several different types according to their use cases and the technologies that underlie them. Here are some of the common types:

    1. Stablecoins

    Stablecoins aim to limit price volatility by being pegged to a stable asset, such as the US Dollar and, in some instances, other fiat currency. Stablecoins are stable, which makes them great for transactional and trading purposes.

    Examples: Tether (USDT), USD Coin (USDC), Binance USD (BUSD)

    2. Utility Tokens

    Utility tokens provide access to a platform or service within an ecosystem created by a particular blockchain. It is generally used to pay for services, governance, or transaction fees.

    Examples: Ethereum (ETH), Chainlink (LINK), Binance Coin (BNB)

    3. Security Tokens

    Security tokens are the representation of ownership of an asset like shares in the company or real estate. These tokens fall under federal security regulations. 

    Examples: Polymath (POLY), tZERO (TZROP)

    4. Meme Coins

    Meme coins emanate from Internet memes or jokes yet gain popularity mostly due to community interests and social media hype. 

    Examples: Dogecoin (DOGE), Shiba Inu (SHIB)

    5. Privacy Coins

    Privacy coins work toward achieving privacy in transactions by hiding the details concerning the sender, receiver, and the amount transacted. 

    Examples: Monero (XMR), Zcash (ZEC)

    How Altcoins Operate?

    Altcoins make use of the blockchain technology – a distributed, decentralized public ledger recording all transactions. Many altcoins rely on some variants of the Proof-of-Work (PoW) and Proof-of-Stake (PoS) consensus strategies to qualify and establish security for transactions.

    Proof-of-Work (PoW): To authenticate the transaction and secure it, miners must solve mathematical problems.

    Construction of New Blocks Proof-of-Stake (PoS): Validators nominated to produce new blocks are selected depending on the amount of cryptocurrencies they have, which is provided as collateral for this block.

    With some altcoins, there are special consensus algorithms such as Delegated Proof of Stake (DPoS) and Proof of Authority (PoA) that help in enhancing the efficiency and scalability.

    What indeed are Altcoins?

    They matter mainly in building up the blockchain ecosystem. They also open new avenues, enhancing much of Bitcoin’s demerits, further purposing diversity. Here is a quick list of some of the best advantages:

    Faster Transaction Speeds – A lot of altcoins process transactions faster than Bitcoin.

    Reduced Transaction Rates – Altcoins generally charge fewer transaction fees compared to the Bitcoin network.

    Good Privacy – This category of altcoins supports anonymity for its users.

    Other Diverse Use Cases – Altcoins are meant to drive decentralized applications, smart contracts, and tokenomics.

    Great Altcoins to Observe by 2025

    The things that have seen almost everything, particularly these two phenomena, are the explosive growth of altcoins and, of course, the expanding cryptocurrency market. Here are some of the most exciting altcoins to watch:

    Ethereum (ETH): The second-largest cryptocurrency responsible for decentralized applications and smart contracts.

    Cardano (ADA): A scalable and secure blockchain platform.

    Solana (SOL): Quick with low prices for transactions.

    Polkadot (DOT): Chains from different blockchains can now communicate with each other.

    Avalanche (AVAX): Your customizable blockchain networks powered by a decentralized platform.

    Risks of Altcoins Investment

    They come with a big amount of risk. Right now, the altcoin space is the most rewarding but it carries as much risk. Most price bubbles burst into thin air when the volatile crypto market creates sharp spikes or drops in price, and a lot of altcoins do not seem to be able to outlast the market over time. Investors should hence do proper research and risk analysis before investing.

    Conclusion

    Altcoins rocked the emerging crypto space by presenting creative options and diverse opportunities for investment, apart from Bitcoin. Whether your passion lies in smart contracts, coins for privacy, or utility tokens, altcoins are the right avenue for every investor. However, you must understand the technology behind, utility, and market dynamics to make the best investment decisions.

    If you want to diversify your cryptocurrency portfolio or try out state-of-the-art blockchain technologies, these fantastic altcoins would do the trick. And remember to DYOR about the latest happenings in the cryptosphere!

    Join our Free Telegram Channel
  • Bank Nifty Tops 55,461 for the First Time Ever

    Bank Nifty Tops 55,461 for the First Time Ever

    Bank Nifty All Time High

    The Indian banking sector is now shining bright in the bullish world as the Bank Nifty climbed to yet another all-time level of 55,461 on 21st April 2025. This surge, with momentum from the splendid Q4 earnings, buoyant credit growth, and renewed interest from foreign investors, denotes strong fundamentals and continuous investor confidence in the Indian banking story.

    Here, we shall take a deep look at what was backing this surge, which banks are leading the charge, and what all traders and investors should watch for next.

    Market Recap: What Happened Today?

    Opening Bell: The index opened strong at 54891.25, fuelled by global cues and positive sentiment in the domestic market.

    Intraday Range: Bank nifty made an intraday high of 55461 before closing right around that mark.

    Volume Spike: A lot more volume was seen today compared to the averages, indicating aggressive and active participation by institutional and retail investors.

    Top Gainers in Bank Nifty

    HDFC Bank was able to achieve great, almost 2.7%, results, thanks to improved margins and solid advances in the increased interest income. 

    ICICI Bank benefited from good post-results behavior, thanks to good NIMs and expansion in the loan book.

    Axis Bank and Kotak Bank gained over 1.5% due to positive sentiment and improving cost-to-income ratios across the sector.

    IndusInd Bank and Federal Bank also rallied in anticipation of Q4 results.

    The Key Drivers Behind This Rally

    1. Strong Q4 Results

    The earnings momentum started from HDFC Bank and ICICI Bank, which, both in fact, delivered strong results above expectations. Major positives are as follows:

    • Increased interest income.
    • Growth in advances and deposits are very strong.
    • Lower levels of provisioning, better asset quality.
    • Improvement in margins due to better transmission on account of rate hikes.

    2. Fresh FII Buy

    Foreign Institutional Investors have returned with a vengeance into the Indian equities market, with banks being a favorite play. The money inflows form an important liquidity cushion, elevating valuations and sentiment.

    3. Credit Growth & Digital Lending Boom

    Whenever RBI data speaks of growth in double digits, be it credit growth mostly of retail & SME nature, it fortifies yet another example of the rise of digital loans along with fintech partnerships breathing yet again into this whole sector of traditional banks.

    Any Risks Ahead?

    Although the rally appears to be on solid ground, the following areas will be subject to caution:

    • Higher bond yields could erode gains from Treasuries.
    • Global market volatility, especially regarding the US Fed policy cues.
    • Pressure on margins if deposit rates shoot up faster than lending rates.

    However, a very healthy cushion exists from their strong balance sheets, large provisioning buffers, and much-improved cost efficiencies.

    What Are Analysts Saying?

    “The Bank Nifty’s breakout above 55,000 opens up potential for a rally towards 56,000–56,200 in the near term,”

    — said a senior technical analyst at Motilal Oswal.

    “Valuations are not stretched yet, and continued earnings upgrades may fuel further upside,” — noted a fund manager at SBI Mutual Fund.

    What to Watch Next?

    Coming up next are banking earnings: for Kotak Bank, SBI, and the smaller private/public banks.

    RBI Policy: Any dovish hints or pause in rate hikes would provide tailwind.

    Global Macro Events: Oil prices, US inflation data, and Fed speak may influence short-term sentiment.

    Conclusion 

    Bank Nifty’s new high isn’t purely technical: It deeply reflects the bank sector development in India transforming itself structurally towards adapting to the digital, macroeconomic, and regulatory shifts. As it drags through the earnings season and with buoyant credit growth, it may well scorch new highs in the weeks to come.

    Markets are moving — are you? Connect with The Safe Trader Academy and trade smarter.

    Join Our Free Telegram Channel
  • Copy Trading-Turn Expert Moves Into Your Profits

    Copy Trading-Turn Expert Moves Into Your Profits

    Copy Trading

    The contemporary financial landscape is in constant change. Within this context, Copy Trading, as it is popularly known, is a game changer for individuals interested in profiting from the expertise of professional traders without active portfolio management. Thanks to copy trading, it now also opens its doors to trading for beginners and investors who often find themselves against time. Equipped with only a mouse and minimal initial capital, anyone can now invest like a pro. This article discusses the other considerations for copy trading, including its workings, advantages, disadvantages, and tips for success.

    What is Copy Trading?

    Copy trading may be defined as an automating trading system whereby investors copy the trade of a professional trader with years of experience and success. The trade of buying or selling an asset made by somebody you have chosen to follow will trigger an automatic buy or sell entry in your own trading account at that same moment in time. In this way, you benefit from all of the potential gains or losses alongside the professional, without putting any thought into the trading decision whatsoever.

    Thus, copy trading tries to resolve the problem that retail investors meet in getting nearer to professional traders. It works by linking the account of the copier with that of a trader who has been selected purposely. All actions of the professional trader are then replicated in the copier’s account in proportion to the amount of capital allocated.

    If, for instance, the trader you copied would put 5% of his portfolio into a certain stock, you would also allocate the same proportion to your account. This, therefore, renders copy trading a passive but really smart investment strategy.

    How Copy Trading Platforms Work

    Copy trading is an activity that requires an investor to sign up with copy trading platforms or brokers. Below is a quick summation of how it works:

    Step 1: Register on a Copy Trading Site

    Platforms like eToro, ZuluTrade, NAGA, and MyFXBook provide good interfaces to browse, analyze and select traders to copy. These platforms aggregate various traders with diverse strategies and performance tracking. It helps copiers know what to do before starting.

    Step 2: Analyze Trader Profiles

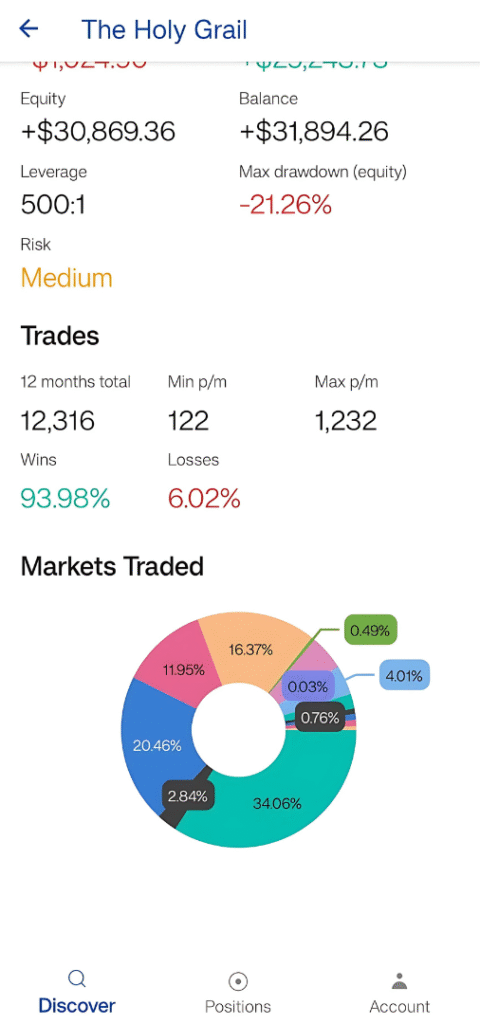
    All traders on a copy trading platform have an extended profile by virtue of which detailed data is found about their trade performance using different assets, win rates on trades, drawdown levels, risk scores, historical returns, etc. This helps copiers filter and compare traders on a basis of such criteria, such as profitability, number of copiers, trading style, and so on.

    Step 3: Capital Allocation 

    Whenever a trader is selected by the copier, the copier allocates towards copying that trader part of his total capital. The amount allocated can be altered over time in accordance with the copier’s preferences and risk appetite. 

    Step 4: Operation of Trading Automatically 

    Any time that the copied trader opens, changes, or closes a position, the same action performs automatically within the copier’s account. The amount of capital the copier allocated determines how the trades are proportioned to the copier and ensures that the returns (and losses) are in sync with the chosen trader’s performance.

    Step 5: Monitoring and Changes 

    Copy trading is mostly automated. It is thus crucial for copiers to keep a close tab on how their selected trader(s) do from time to time. Investors have the option of halting copying, reallocating capital, or changing a certain trader if their performance does not meet the expected outcome.

    Check Out These Successful Copy Traders!

    Check Copiers, Return History, Profitability, Leverage, and Risk to choose the right trader

    Copy Traders List
    Copy Trader
    Copy Trader

    Types of Copy Trading Models

    Modified forms of copy trading are available to accommodate investors’ different needs in some cases. This flexibility is helpful when one invests in the model that matches one’s goals and risk exposures.

    1. Manual Copy Trading

    For manual copy trading, investors carry out the analyses and selections of the trades they want to copy. This may be considered the main drawback of having less control over what trades will be copied. But on the flip side, it requires some level of understanding of the markets and perusing every opportunity for trading.

    2. Automated Copy Trading

    This is indeed the most popular and easiest model, wherein all trading decision making and thus their executions are immediately mirrored in the account of the copier. The moment a trader is chosen and the capital allocation made, the system takes control of everything in real time.

    3. Social Trading

    As an extension of copy trading, social trading brings community features to the service: it allows users to copy trades but can also interact, discuss strategies, and share insights into market trends with other traders. In combining the benefits of copy trading with those of collaborative learning, social trading yields an improved form of copying.

    Key Benefits of Copy Trading 

    1. Perfect for beginners: Beginners can skip most of the rocky process of learning by depending on the skill of professional traders. Copy trading reduces the engagement of much technical analysis or even deep market knowledge. 

    2. Save Time and Energy-it is hassle-free for pre-occupies individuals without time to study markets or plan trading strategies.

    3. Obtaining Different Strategies-It allows all investors to experiment with different trading styles like day trading, swing trading, or longer investment by copying more than one trader using another approach.

    4. Spreading the Risk-Investors can follow different traders or approaches and thus have more risky portfolios to reduce the overall risk associated with depending on a particular strategy.

    5. Transparency with Real-Time Insights: Most copy trading platforms offer a complete transparency perspective with a clear record of historical data performance, risk levels, and trading patterns of the professional traders, which provides the necessary foundations to make informed decisions. 

    6. Learning It also becomes an application through which beginners can learn the reasons for specific trades by watching expert proceedings about market trends.

    Challenges and Risks in Copy Trading

    If copy trading has a lot of benefits, it still poses some threats and dangers. Knowledge of these hurdles would better place investors in decision-making.

     1. Guarantees on Zero Profits

    Even the best-skilled trader suffers losses in trade, which mere copying will not guarantee the same behavior. The market tends to fluctuate and go wrong due to unknown factors.

    2. Risk of Over-Reliance

    When traders rely on one single trader, they could suffer much higher risks if that trader’s strategy fails or has a bad streak of losing.

    3. Platform Dependency

    The robustness of the copy trading platform is of prime importance. Technical glitches, delays in execution, or system failures may further restrict traders from replicating trades.

    4. Fees and Commission Costs

    These platforms mostly charge commissions, performance fees, or spread charges, which will eat into the copier’s returns significantly.

    5. Limited Control Over Trades

    There are limited capabilities for copiers in automated copy trading regarding each trade, which sometimes causes them to lose the chance for manual adjustments.

    Best Practices for Successful Copy Trading

    To add in maximizing one’s copy trading ability, it is important to adopt a certain strategic approach. Following are some best practices with respect to copy trading:

    1. Diversify Your Portfolio

    Copy not just one but several different traders using various strategies and asset classes. Allow your diversification for spreading risks and enhancement of overall stability.

    2. Analyze Trader Performance

    Consider traders, not just among other things, but on the basis of long-term performance, risk appetite, and consistent performance rather than short-term gains. Scour for traders with no drawdown and evidenced sustainable growth.

    3. Start Small and Scale Gradually

    Squeeze into a small allocation to experiment with it first, then scale upwards when confidence in that platform and the chosen trader has been achieved.

    4. Monitor and Review Regularly

    Automated copy trading goes, but it still calls for a periodic performance review and a chance to adjust if necessary. What happens if the results go haywire?

    5. Understand the Risks Involved

    Learn about potential risks and place stop-loss limits to protect capital from excessive losses.

    Is Copy Trading Right for You?

    Copy trading seems a good alternative for many who wish to step into the trading world but have no knowledge or time to analyze the market. It is best suited for:

    • The newcomers who want to learn about trading by observing the professionals. 
    • The passive investors want to maintain a hands-off approach to trading.
    • The busy professionals wish to diversify their sources of income without allocating time to trading.

    On the other hand, copy trading may not appeal to those desiring complete control over their trading decisions or who dislike high-risk scenarios. 

    Conclusion

    Copy trading is a great way for both novice and experienced investors to rely on the knowledge of seasoned traders while saving a lot of time. While this is a good passive income-generating opportunity, one must understand the risks involved and diversify the investment strategy as a measure against these potential losses. Devising a strong selection of traders, combined with proper risk management, solid performance monitoring, could see copy trading morph into a significant contributor to the building of a strong, diversified investment portfolio.

    Looking to Open a PU Prime Account?

    ✅ Get started today with ThesafeTrader!

    📈 Open PU Prime Account:
    https://in.puprime.com/forex-trading-account/?affid=60590

    📈 Verify Your Account:
    Make sure to complete all necessary verification steps to ensure your account is active and compliant with regulations. You need Aadhar Card & Bank Statement.

    📊 Download MT4 Android App
    https://drive.google.com/file/d/1-_tRSHoX6BSUmCDkJCOhOSUT3E1na_pq/view?usp=sharing

    📊 Download MT5 Android App
    https://drive.google.com/file/d/1YTzaNHhNgWmhKdx5XcgmQLR7bHyJqxfq/view?usp=sharing

    Join Our Free Telegram channel

  • Indian Stock Market : Key Insights and Trends in 2025

    Indian Stock Market : Key Insights and Trends in 2025

    From Panic To Profit Bulls Take Charge

    Market Overview

    The Indian stock market has finally started to recover after its long stagnation. Key indices like Nifty 50 have rallied in recent trading sessions, with many large stocks also giving spectacular returns. While the market faces challenges, such as the IT sector not doing very well, it appears to be on the mend, with sectoral recoveries, positive FII inflows, and global cues regarding the price movements of gold and crude oil aiding the recovery.

    1. Nifty 50: Strong Recovery of 10%

    Nifty 50 Closing (April 17, 2025): 23,851.65

    The Nifty 50 has bounced back against the lows by 10 percent in the last seven days to close at 23851.65 on April 17, 2025. This rally has been backed by sectoral support largely coming from banking, energy, and metals. The more robust the rally, the more the market seems to be stabilizing after prior corrections.

    2. Reliance Industries: Strong Uptick of 15%

    Reliance Industries : ₹1,274.50 (₹35.20 or 2.84%)

    7-Day Growth: +15%

    Reliance Industries surged 15 percent in value over the past week to close at Rs 1274.5 per share, benefiting from a diversified business model, covering telecom, retail, and energy. Rising crude oil prices have also buffeted the $200 billion company’s energy and petrochemical arms.

    3. FII Flows: Positive Sentiment Returns

    Foreign Institutional Investors (FII) have started to return to the Indian stock market, signaling a shift in sentiment. After a period of cautious outlook, the return of foreign capital has been one of the key factors driving the market’s recent uptrend. This renewed interest in Indian equities reflects growing optimism about India’s economic recovery.

    4. Recovery in Key Sectors: Sectoral Rebounds 

    Those sectors which experienced a lot of losses during the earlier months are now galloping towards recovery. Well among the key sectors:

    Banking Sector: The three banks- HDFC Bank, SBI and ICICI Bank are continuously posting lifetime highs, thanks to excellent earnings and brightened expectations on credit growth.

    Energy Sector: With the revival of crude oil prices, Reliance Industries and all other energy companies captured a golden chance.

    Metals: Companies in metals will immediately get an upward thrust after the international commodity price recovery.

    5. Global Factors

    The Tariff War Comes to a Standstill, Energy Elements Requisite for Crude Oil Recovery 

    The tariff war between major global economies has become a mere shadow, maintaining a low level of uncertainty in the global market. Its halts will encourage growth in trade-sensitive sectors. Moreover, crude oil price recovered to $64.68 per barrel and will cultivate famous winds for energy crews like Reliance Industries and ONGC. 

    6. Gold Price Soars to All-Time Highs 

    Gold Price: ₹100,000 per 10 grams

    Gold has reached its all-time maximum of ₹100,000 for 10 grams. Currently, the buzz in gold prices is propelled mainly by global economic discontinuities, inflation fears, and a move towards safe haven assets. With a mass inflow of global investors into gold, it would perhaps mean a general caution towards economy-related issues.

    7. Peaked Crude Oil Prices

    Crude Oil Price : $64.68 per barrel (+2.21%)

    Moving up in price, crude oil now stands at $64.68 per barrel and up 2.21%. Supply-side disruptions combined with recovery in general demand support the rise in crude prices; thus, benefiting companies in the energy chain and oil refining sector, among which Reliance Industries may be benefited in the process.

    8. Strong Performers in the Banking Sector

    The banking sector has become one of the strong performers in 2025, with several top banks reaching fresh lifetime highs.

    These banks have rewarded investors with 18% returns in 2025 so far, touching new all-time highs with HDFC Bank, ICICI Bank, and State Bank of India.

    Axis Bank, specifically, was a good performer, giving 28% return during 2025, thanks to solid growth in retail banking and digital adoption, along with a growing loan book.

    9. IT Sector: Infosys and TCS in Trouble:

    A major troublemaker for the IT sector, Infosys and TCS have seen 28%-to-30% losses so far in 2025. Several reasons to account for these underperformances are: 

    Global Economic Slowdown: Poor demand for IT services in key international markets, such as the US and Europe. 

    Increasingly Competitive: Undercutting competition from newly emerging markets, with particular reference to Eastern Europe and Southeast Asia. 

    Technological Disruption: The automation and Artificial Intelligence Highway is reducing demand for traditional IT outsourcing services.

    Conclusion: A Dynamic Market in Transition

    The month of April 2025 has seen a remarkable turnaround in the Indian stock market owing to surges in one sector or another, favorable performance from banks, and raising investor confidence. The last seven trading days have seen Nifty 50 recover by 10%, led by banking and energy sector stocks on a rally that has seen Reliance Industries gain around 15% from recent lows with gold touching a new all-time high. 

    The market will not be kind to all sectors. While banking, energy, and commodities may see positive technicals to continue in their upward momentum, it is the visible weakness of the IT sector that serves as a reminder to investors of the importance of macroeconomic and technological disruption forces in judging the performance of a certain stock.

    Investor opportunities versus challenges remain. Investors must focus on maintaining a diversified portfolio and sectoral analysis while dealing with such an extraordinary market.

    Join our free telegram channel
  • Why Gold Is Booming: Fundamentals, Buyers & Forecasts

    Why Gold Is Booming: Fundamentals, Buyers & Forecasts

    Gold Rates Hit Record High

    Gold has always been an asset and it is going to be in the next heights in 2025. In India, gold would have already reached 1,00,000/- rupees per 10 grams with a global price touching $2,000 an ounce for this precious metal as it quickly fills in the gaps by following inflation in the world, risks related to geopolitics, and steady central bank buying. So, why arrange such extreme gains for gold, and what does it hold for investors? Let’s unravel it all.

    Understanding the Surge in Gold Prices

    In April 2025, the price of gold was at an all-time high and is the result of several factors that have contributed to this increase over many years. However, to really appreciate the significance of this increase, we need to examine some of the key drivers:

    Latest Gold Trends (2025)

    The Fundamentals of Gold

    Gold holds attraction for its intrinsic value and function as a safe-haven asset. Unlike paper currencies, gold exists in finite quantities, and its value is preserved over time owing to its inverse relation with scarcity. The following are the primary reasons behind gold retaining its ever-important place in the global economy:

    1. Store of Value

    It is mostly classified as a hedge against inflation and uncertain economic times. Investors use gold to preserve wealth against inflation weakening the currencies.

    2. Demand from Central Banks

    Countries such as China, Russia, and India have also been continuously increasing their gold reserves over the last decade. Demand for gold from the central banks has surged as these countries have the will to lessen their dependency on the dollar and diversify foreign reserves. 

    3. Cultural Significance

    Gold in India and China has both investment value and immense cultural significance. In these countries, gold remains an attractive investment as it becomes prevalent during various festivals and wedding ceremonies, standing as a symbol of wealth and prosperity and keeping demand strong year after year.

    Historical Performance of Gold

    To understand the recent surge, it’s helpful to take a look at how gold has performed historically. Here’s a snapshot of the past few years:

    Gold saw its largest surge in 2020, driven by the global pandemic, stimulus packages, and low interest rates. But the momentum didn’t stop there. 2024 witnessed a 27% price increase, as the global economic landscape remained unstable.

    Who’s Buying Gold?

    Now, central banks continue to retail investors and institutional purchasers: This share of consumers will be analyzed according to:

    1. Central Banks

    Countries like China, Russia, and India purchased massive amounts of gold. In 2024 alone, central banks amassed 1,180 tons of gold, creating a new record in this type of gold demand. The consumption trend reflects the awakening interest in diversifying economies away from the U.S. dollar and reinforcing their countries’ foreign exchange reserves.

    2. Retail Investors

    Gold has been the best investment for centuries, especially in countries like India and China, where gold is revered culturally and financially. Demand continues to be reinforced as the festivals and weddings are upon us. Furthermore, gold ETFs are now fast gaining acceptance among those who want to invest in gold in a more accessible and liquid form.

    3. Institutional Investors

    Now, more and more institutions, hedge funds, and pension funds in particular, are moving into gold. Part of the reason for it is that institutions want to hedge against inflation and/or volatility in market conditions, especially during periods of economic uncertainty.

    Why Are Gold Prices Soaring?

    Gold’s 2025 surge can be attributed to several macroeconomic factors:

    1. Inflation

    One of the major factors is inflation. The rise in global inflation levels erodes real values of fiat currencies. Hence, gold served as a store of value in such circumstances, attracting investors wishing to preserve their wealth.

    2. Geopolitical Tensions

    Gold benefits when geopolitical clouds gather: from the Russo-Ukrainian war to tensions in Asia. Investors acquire gold as a safe-haven asset whenever confrontations impact traditional markets.

    3. Weakening U.S. Dollar

    A weak dollar in the U.S. is favorable toward gold in the eyes of foreigner investors. With the dollar’s strength waning, gold becomes cheaper in foreign currency terms, thus enhancing global demand. 

    4. Low Real Interest Rates

    Though some interest hikes were instituted by the Central Banks, many economies with the U.S. and Eurozone still have negative real rates which is a cause for concern. Profitable avenues for investment with no opportunity cost of holding such low-returning assets will find a fair market through gold.

    Where Are Gold Prices Headed in 2025?

    Gold’s upward trajectory seems likely to continue. Based on current market conditions, here’s the outlook for the next few months:

    • Global Price: Experts forecast that gold could hit $2,100 to $2,200 per ounce by mid-2025. A continued rise in inflation and geopolitical tensions could push prices even higher, possibly even reaching $2,500 per ounce.
    • Indian Price: The price of 10 grams of gold in India could cross ₹1.20 to ₹1.50 lakh by the end of the year, driven by festivals and wedding season demand.

    Is This Surge a Sign of a U.S. Recession?

    Though gold price rises continue to raise questions regarding the overall economic outlook, many investors are worried about a looming U.S. recession; hence, gold, a safe-haven asset these days, tends to be favored. Normally, gold performs well during economic downturns, making it a prudent investment during uncertain times with recession apprehensions.

    Conclusion: What Does the Future Hold for Gold?

    Gold continues being a resilient asset-class with a long-term implication for 2025 being promising. Though short-term wiggles may arise from interest rate increases or stock market rallies, the macroeconomics indicates that gold is going to continue doing well. 

    Whether you are drawn as an individual investor or central bank or institutional buyer, knowing the components that drive gold price is central to surfing this market. High inflation, geopolitical uncertainty, and low interest rates probably will continue pushing gold prices higher, thereby making it a lucrative asset for a long time ahead.