Thesafetrader

Author: thesafetrader.in

  • Circuit Breakers in the Indian Stock Market

    Circuit Breakers in the Indian Stock Market

    Circuit Breakers

    The Indian stock market, like many other global markets, is structured with certain safety measures to check excess volatility. One such important measure is the circuit breaker.

    A circuit breaker means halt in trading for a temporary period of time imposed upon a stock, index, or the whole market in cases where their price crosses pre-specified limits. These limits are set as percentage price changes(days containing upward or downward movements) in a single trading session. Circuit breakers are thus triggered in cases of panic selling or irrational buying to protect investors from sudden losses.

    LCL and UPL: What Do They Mean?

    • LCL (Lower Circuit Limit): The maximum percentage a stock can fall in a day. If the price hits this limit, trading is either halted or shifted to a cooling-off period.
    • UPL (Upper Circuit Limit): The maximum percentage a stock can rise in a day. This helps control excessive speculative buying.

    LCL – Lower Circuit Limit

    The Lower Circuit Limit is referred to as the maximum allowable drop in the price of a stock or index throughout a trading session. When the price of a stock reaches this limit, either trading is suspended, or it may be temporarily halted in order to allow for a cooling period in the market or for reassessment. 

    Example:

    If a stock opens at ₹200 and has an LCL of 10%, then it cannot trade below ₹180 through the course of that trading session. Should it touch ₹180, it will be considered a lower circuit, and trading might be stopped.

    UPL – Upper Circuit Limit

    The Upper Circuit Limit is basically the maximum upward movement in the price of a stock in a trading day. Thus, it prevents excessive speculative purchases by speculating to inflate the stock price.

    Example:

    If the same stock at ₹200 has a 10% UPL, the price cannot go above ₹220. If it touches ₹220, the stock hits the upper circuit, and trading is halted or restricted.

    These limits are dynamically managed by SEBI (Securities and Exchange Board of India) and are enforced by the exchanges — NSE and BSE.

    Circuit Limit Categories in India

    The circuit limit for a stock or index is set based on its volatility and liquidity profile. Here are the standard levels:

    CategoryPrice Movement Limit (±)
    High risk5%
    Medium risk10%
    Moderate risk15%
    Others20%, 25%, or 30%

    Example:

    If a stock has a 10% circuit limit and closes at ₹100 the previous day:

    • UPL (Upper Price Limit) = ₹110
    • LCL (Lower Price Limit) = ₹90

    No trades can take place beyond these limits on that day.

    How Are These Limits Calculated?

    Circuit breakers are calculated based on the previous closing price of the security.

    How is LCL Calculated?

    The LCL is calculated based on the previous day’s closing price of the stock or index.

    📊 Formula:

    LCL Price = Previous Close – (Previous Close × LCL %)

    🔎 Example:

    A stock closes at ₹100. If it is under the 10% circuit filter:

    • LCL = ₹100 – (₹100 × 10%) = ₹90
    • If the stock falls to ₹90, it hits the lower circuit, and trading is halted or restricted.

    How is UPL Calculated?

    Just like LCL, UPL is also calculated based on the previous day’s closing price.

    📊 Formula:

    UPL Price = Previous Close + (Previous Close × UPL %)

    🔎 Example:

    A stock closed at ₹500 yesterday. If it’s in the 10% category:

    • UPL = ₹500 + (₹500 × 10%) = ₹550
    • The stock cannot rise above ₹550 for that day.

    Index Circuit Breakers (NIFTY, SENSEX)

    For benchmark indices like NIFTY 50 and SENSEX, the circuit breakers are standardized at 10%, 15%, and 20%.

    Trading Halt Duration (Index-Based)

    MovementTime of TriggerTrading Halt Duration
    10%Before 1 PM45 minutes
    10%1 PM – 2:30 PM15 minutes
    10%After 2:30 PMNo halt
    15%Any time1 hour 45 mins
    20%Any timeRest of the day

    Example:

    If NIFTY falls 10% at 12:30 PM, the entire market halts for 45 minutes.
    If NIFTY crashes 15% at 11:00 AM, markets pause for 1 hour 45 minutes.

    Who Decides These Circuit Limits?

    The circuit limits are decided by:

    • SEBI (Securities and Exchange Board of India) – the regulatory authority
    • Exchanges (NSE & BSE) – enforce and update them
    • The limits are revised from time to time depending on market behavior, stock volatility, and investor participation.

    What Instruments Do Circuit Breakers Apply To?

    Instrument TypeCircuit Limits Apply?
    Stocks✅ Yes
    Futures✅ Yes
    Options⚠️ Not directly, but underlying movement affects them
    Indices✅ Yes

    Options are indirectly affected — since their price is based on the underlying, a halt in the stock/index will pause option trading too.

    Why Are Circuit Breakers Important?

    • Prevent market crash due to panic selling
    • Provide a certain amount of time for investors and traders to digest information
    • Maintain fairness and orderliness in market
    • Shield retail investors from serious price shocks

    What are the advantages of circuit breakers in the stock market?

    Circuit breakers in stock markets offer a range of advantages to the investor:

    Panic is reduced: Since the trading is temporarily put on hold by the circuit breaker, investors can take their time to digest some market news and make cool-headed decisions, which go into rationale instead of impulsive or emotion-driven ones.

    Decision-making becomes more informed: Investors are provided a short window to evaluate market performance, news updates, and corporate announcements before opting for rational decisions.

    Market stability issues are minimized: Circuit breakers safeguard some degree of stability with forced periods of extreme volatility so that price changes do not occur in a sudden and extreme manner within a relatively short time.

    What are the disadvantages of circuit breakers?

    Increased Panic: In an ironic manner, such a feature can create panic sometimes. When a sudden halt happens, investors would feel they might lose the opportunity to sell or to buy. 

    Artificial Price Volatility: Circuit breakers, albeit maintaining a certain level of price stability, may disrupt the natural price mechanism creating artificial volatility. Artificial volatility translates to inefficiency of the market since orders may tend to pile up at circuit limits.

    Liquidity Reduction: Halts may potentially affect liquidity as investors cannot trade within suspension periods with possible repercussions on market functioning.

    When have circuit breakers been triggered in India?

    Circuit breakers in India have been triggered times over, especially during market volatility and significant events. Here’s an account on some of the notable instances:

    1. March 2020 (Pandemic & Real Market Crisis): Global markets crash during the initial onslaught of COVID-19, followed closely by Indian markets. On March 13, 2020, the Sensex got lower circuit by 10%, resulting in the halt of trading for 45 minutes. This was a landmark occasion as it showed the global spread of the pandemic’s effect on financial markets. 

    2. 2001 (Ketan Parekh Crash): The Circuit breakers came into play in the year 2001 during the Ketan Parekh crash, showing the effects of stock market manipulations and fraud. 

    3. 2008 (Financial Crisis): The global financial crisis further saw circuit breakers getting triggered in the Indian market, as the ripples of global economic turmoil found their way to Indian markets. 

    4. 2004 (Post-General Elections): After the 2004 general elections trading was halted many times as investors expressed concerns regarding the uncertain policy direction of the new Government.

    Conclusion

    Circuit breakers are like a necessary safety net in an increasingly jittery, sentiment-driven market. As Indian markets gain global traction and more retail participation, the onus for investor protection remains uppermost.

    With an understanding of LCLs and UPLs, along with varying bands, traders and investors are better positioned to make reliable decisions and avoid trading during volatile price action.

    👉 Enroll today and become a smarter, safer trader.

    join our free telegram channel
  • India Becomes Asia’s Most Favored Stock Market in 2025

    India Becomes Asia’s Most Favored Stock Market in 2025

    Asia’s Most Favored Stock Market

    Global Investors Turn Bullish on India Amid Shifting Economic Winds

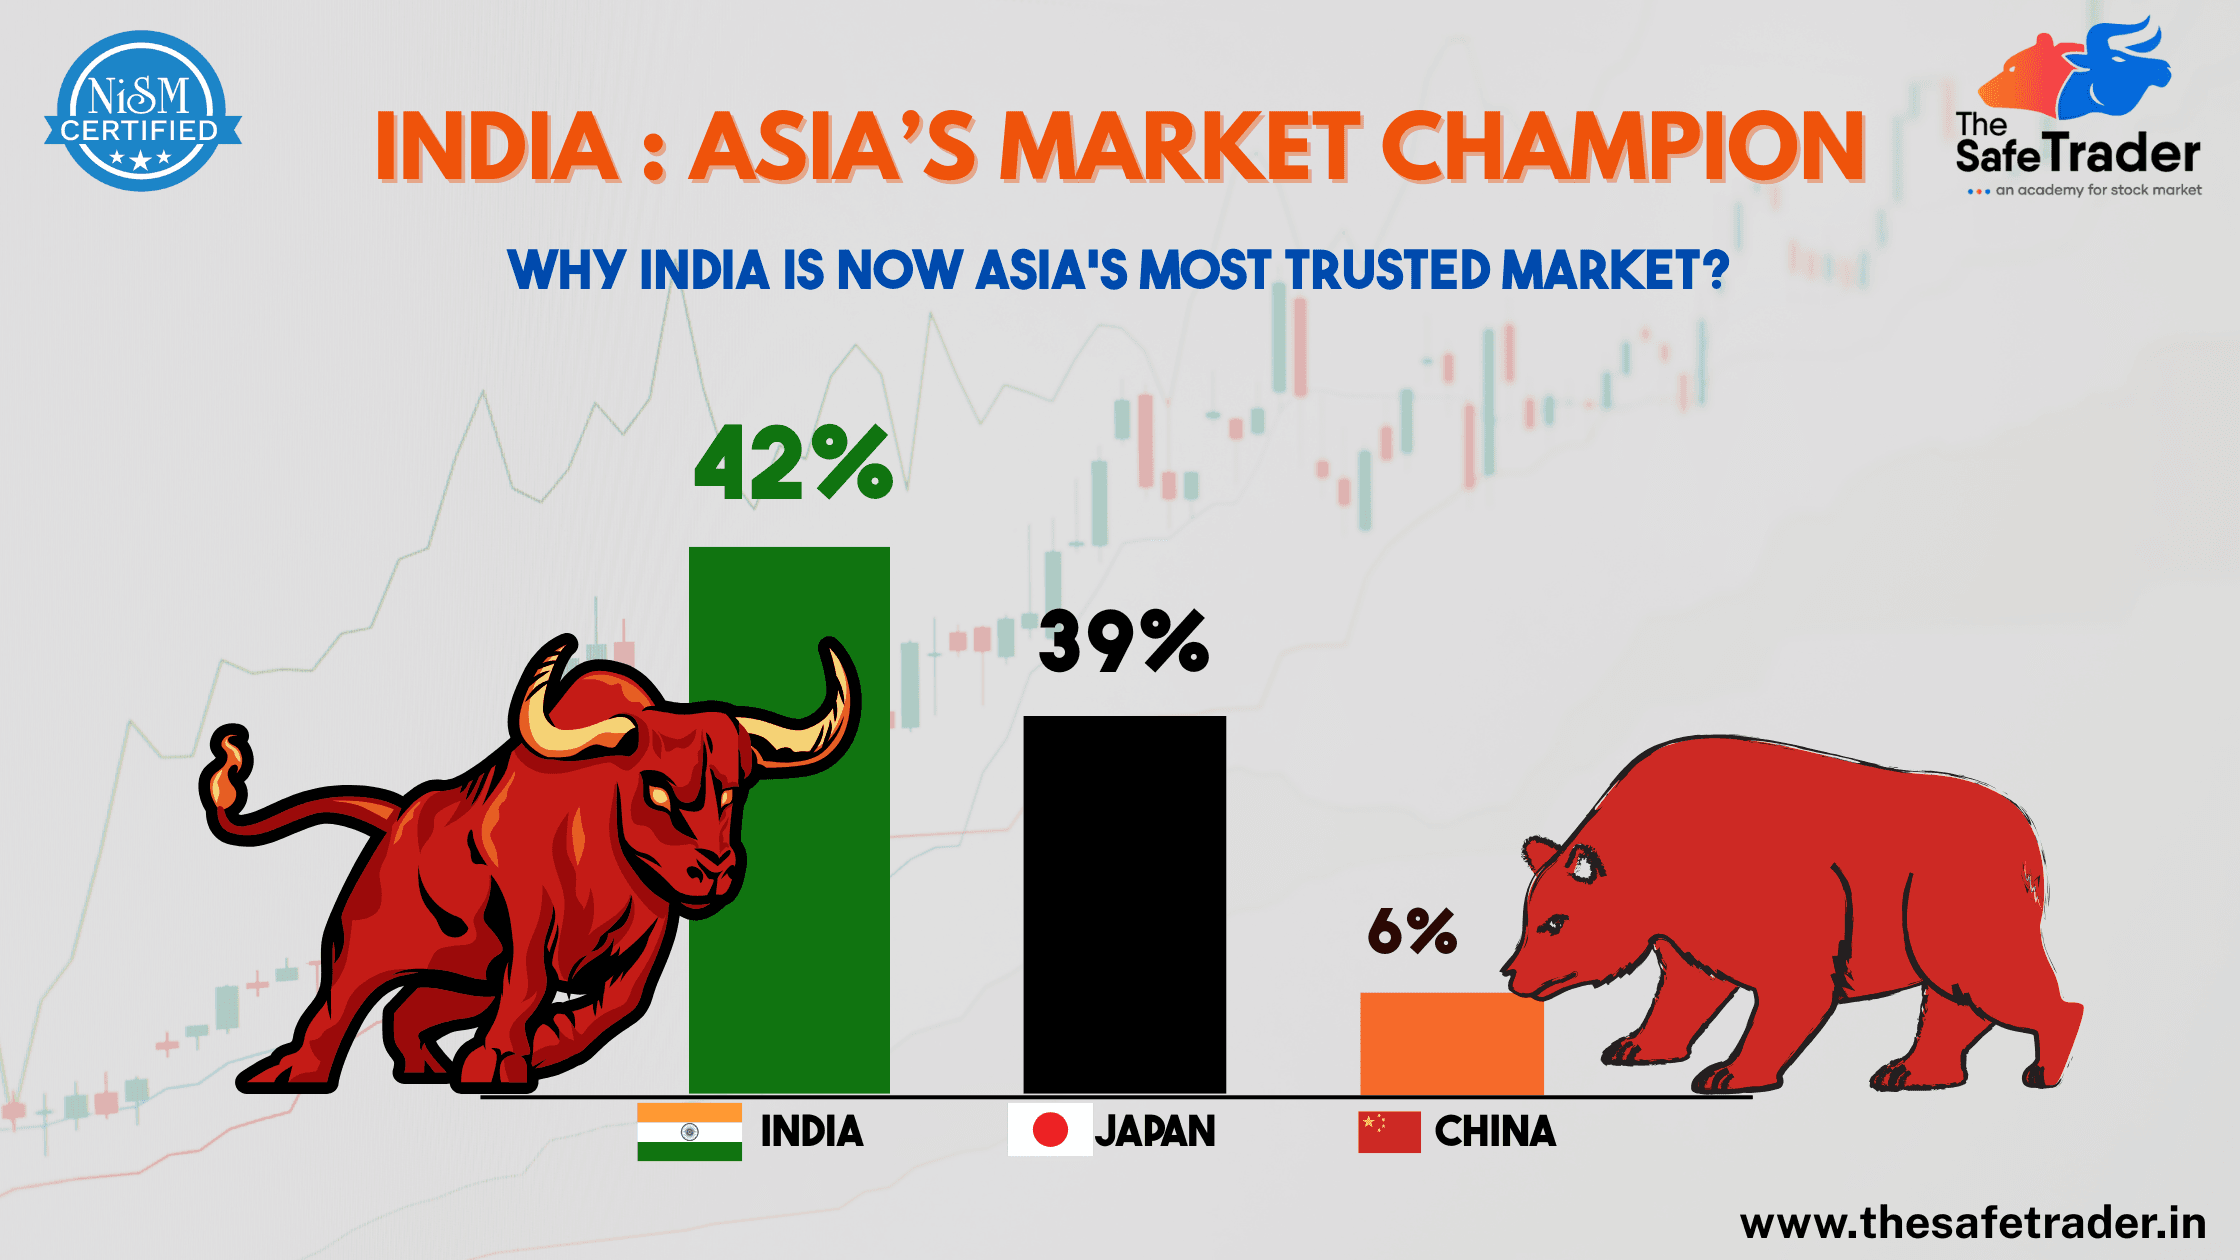
    According to the Bank of America Global Fund Manager Survey ( 2025), India has been placed atop the ladder ahead of Japan and China to be Asia’s most preferred equity market. The study reveals investor preferences of the global fund managers of 2025: 

    • 42% would prefer India, 
    • 39% would favour Japan, 
    • while only 6% favoured China. 

    This is a deep change in sentiment which might very well set the course for Asia’s financial landscape in the coming years.

    Why Global Investors Are Betting Big on India

    The Indian stock market is not just “hot”; it is really undergoing structural evolution, and these are the reasons why bullishness is ultimately charging through:

    1. World’s Fastest-Growing Major Economy

    In FY25, India is expected to grow anywhere between 6.8 and 7.2 percent, faster than any other G20 economy. Despite a lackluster external environment, India has remained resilient in the macroeconomic front, a strong consumer base, and consistent corporate earnings.

    2. FII Inflows at All-Time Highs

    More than ₹1.2 lakh crore have been poured by Foreign Institutional Investors (FIIs) into Indian shares in mere Q1 of 2025. Sectors in limelight are:

    • Banking & Financial Services
    • Green Energy & EV
    • Telecom & Digital Infrastructure
    • Manufacturing under PLI schemes

    Global capital now views India as core allocation, not just a satellite emerging market.

    3. Geopolitical Advantage Over China

    Growing US-China tensions, regulatory clampdown in Beijing, and opaque capital markets have all pushed investors to opt for diversification away from China, with India being a prime alternative:

    • Democracy and transparency
    • Legal protection to foreign investors
    • Tech-driven reforms

    4. Stable & Reform-Oriented Government

    Political stability in India, under a reform-oriented regime, has given a further push to investor confidence:

    • Simplification of tax structures (GST)
    • Digitalisation of public services
    • Infrastructure boom: ₹111 lakh crore planned under National Infrastructure Pipeline

    Data-Driven Market Sentiment

    CountryInvestor PreferenceKey Strength
    India42%Growth, Reforms, Demographics
    Japan39%Safe haven, mature tech sector
    China6%Declining due to policy risk

    Notably, India’s outperformance vs China reflects global trust in economic governance and scalability.

    Technical & Market Indicators (as of May 2025)

    • Nifty 50: 24,975.70 
    • Sensex: 82,205.55
    •  India VIX is reported at 16.62.
    • Foreign Portfolio Investors (FPIs) have shown renewed interest in Indian equities, with net purchases of ₹11,663 crore in May so far, following ₹3,416.08 crore in April .

     India vs Japan vs China: Comparative Analysis of Asia’s Top Stock Markets

    The investor sentiment shift is more than just a popularity contest—it’s based on real, measurable differences across these three economic powerhouses. Here’s how India, Japan, and China compare across critical dimensions that matter to investors.

    CategoryIndiaJapanChina
    Investor Preference42% (Rank #1)39% (Rank #2)6% (Rank #3)
    GDP Growth (2025 est.)6.8% – 7.0%1.1% – 1.5%4.5% – 5.0%
    Population DynamicsYoung, median age ~28Ageing, median age ~49Median age ~39, but declining
    Stock Market ReturnsStrong; Nifty/Sensex risingStable; Nikkei at record highsVolatile; regulatory concerns
    Reform MomentumHigh – digital, manufacturingModerate – governance-focusedLow – unpredictable policies
    Ease of Doing BusinessImproving rapidlyVery highDeclining due to crackdowns
    Foreign InvestmentGrowing FDI/FII inflowsStable, mature inflowsDeclining due to capital flight
    Geopolitical RiskLow to moderateLowHigh (US tensions, Taiwan issue)
    Innovation & TechRapid growth in fintech, AIStrong in robotics, automationLeading in AI, but restricted
    Market TransparencyImproving regulatory frameworkHigh regulatory maturityLow due to state control

    Investment Outlook. What Should Traders Do?

    For stock traders, investors, and learners at The Safe Trader Academy, this shift presents major opportunities:

    Strategic Takeaways:

    • In view of the rotation by FIIs into mid-cap and infrastructure growth spaces, focus on Indian mid-caps and infrastructure stocks.
    • Use technical analysis to track breakout patterns in Nifty Bank, FMCG, and PSU stocks.
    • Short-term volatility shall be generated by announcements of RBI policies and quarterly earnings.
    • Long term view: India equity market continues to have a long runway ahead.

    Conclusion:

    The era of “Will India Rise?” has now transformed to “How far and how fast are they going to rise?”

    With favorable demographics, digital momentum, and global capital flowing in, India isn’t just Asia’s hottest stock market—it’s the new growth engine of global equity markets.

    Whether you’re a retail investor, institutional fund manager, or an aspiring trader, India is the market to watch—and to act on.

    👉 Enroll today and become a smarter, safer trader.
    Join our free telegram channel
  • Mastering Market Charts: Complete Guide to Chart Types

    Mastering Market Charts: Complete Guide to Chart Types

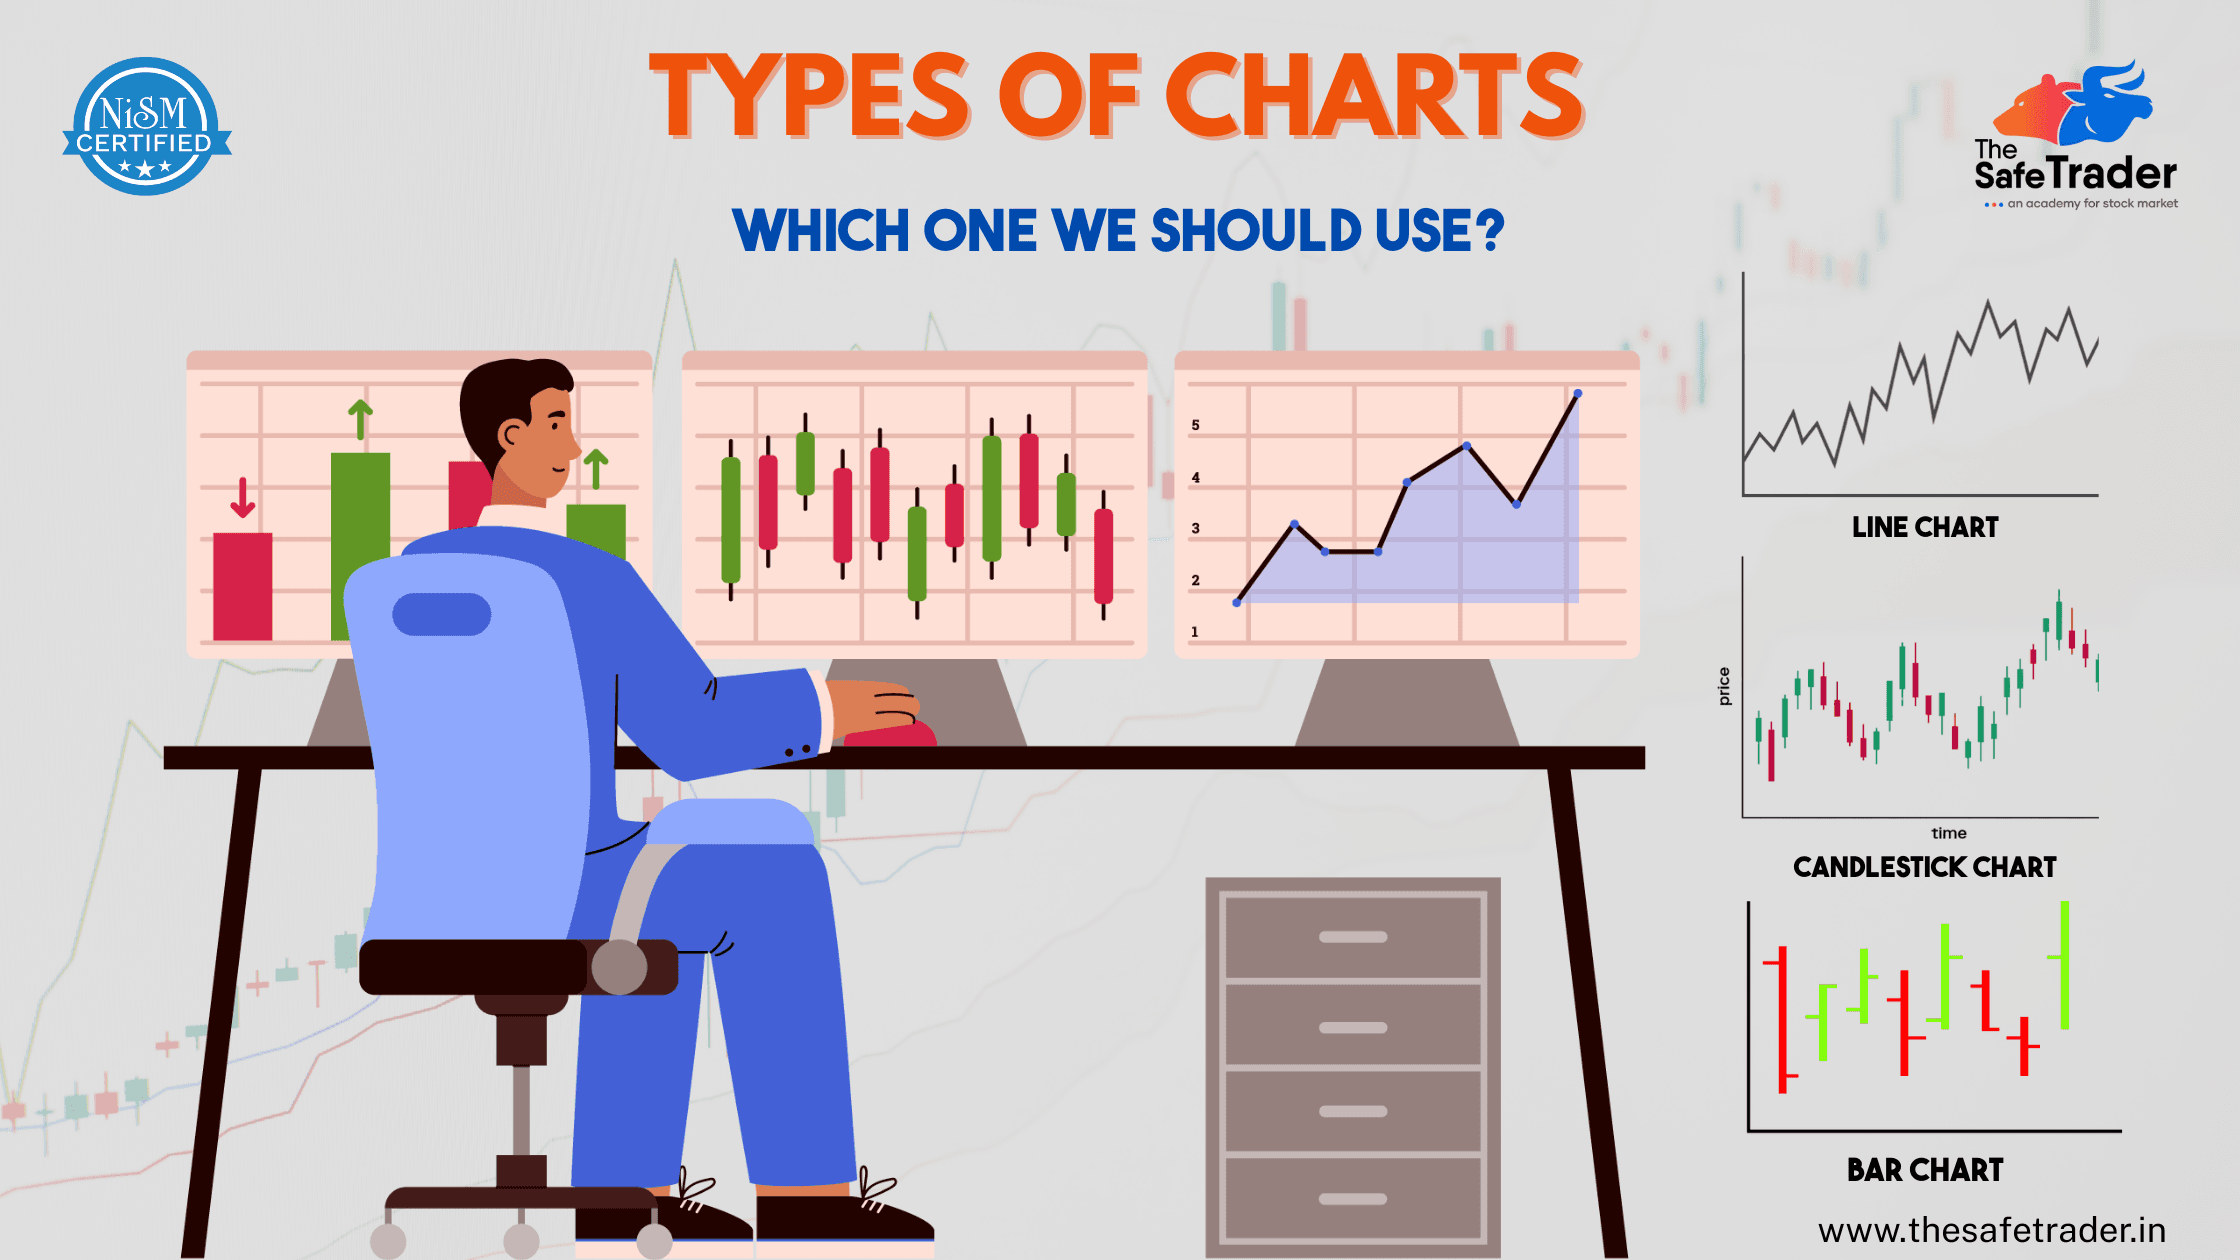
    Types Of Charts

    In every trader’s journey, market interaction is crucial for success; charts assist in this undertaking. These charts serve many purposes, from confirming trends and reversals to selecting precise entry and exit points; any trader must learn the art of chart analysis.

    In this guide, we have attempted to describe the six major types of charts, their uses, and the environments that favor each type. In addition, some overlays and indicators will be introduced that could help you improve your ability to read charts.

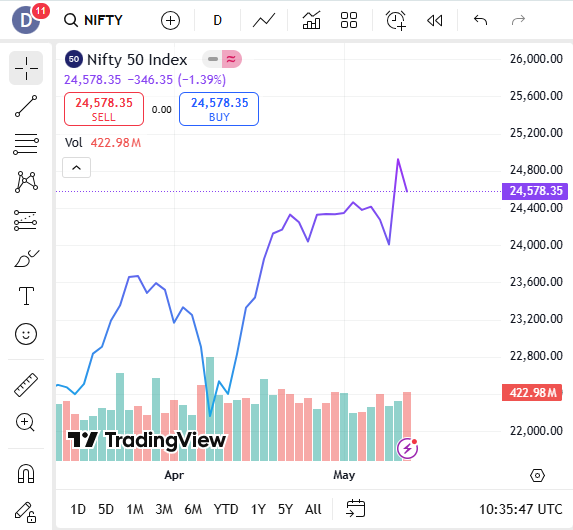
    1. Line Chart

    Best For: Beginners, long-term investors, quick trend overviews

    A line chart is the simplest type of chart. It plots only the closing prices over a specific time period, connecting them with a line.

    Use It When:

    • You are interested in a quick snapshot of the overall direction of the price.
    • Comparing many assets against each other without distractions.
    • Focusing on long-range movements and macro trends.

    Pro Tip:

    Line charts also help to identify major support or resistance over weekly or monthly timeframes; they are great at suppressing short-term noise.

    Line Chart

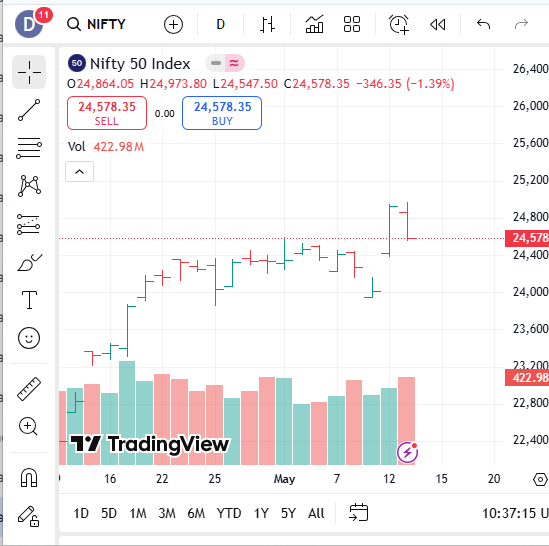
    2. Bar Chart (OHLC Chart)

    Best For: Intermediate traders, price range analysis

    Each bar represents a time period and shows Open, High, Low, and Close (OHLC) prices. The left notch is the open, the right is the close.

    Use It When:

    • Whenever you want to get detailed price information without switching to candlesticks.
    • To get a feel for price ranges and volatility during a given period.
    • Trading price breakouts or fade away.

    Pro Tip:

    Use bar charts with volume indicators to see if prices are moving with institutional support.

    Bar Chart

    3. Candlestick Chart

    Best For: Most traders, especially those who use technical analysis

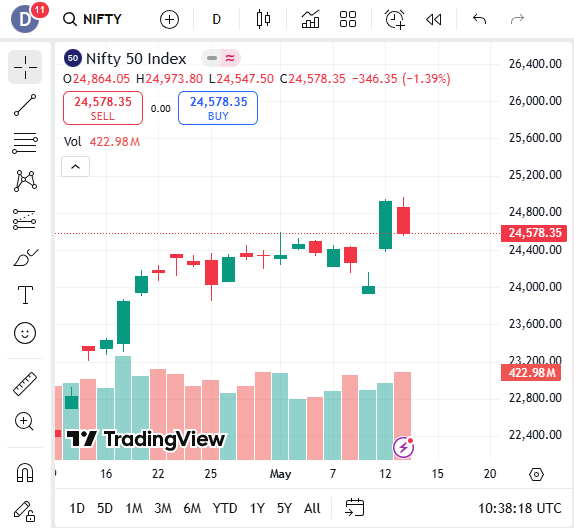
    Candlestick charts display the same OHLC data as bar charts, but in a color-coded, visual format. Green (or white) candles typically show bullish movement, while red (or black) indicate bearish.

    Use It When:

    • To identify the market sentiment, reversals, or continuation patterns.
    • For trading short-term (day or swing trading).
    • Whenever you use candlestick patterns such as Engulfing, Hammer, Doji, etc.

    Pro Tip:

    Multiple time frame analysis is useful. For example, check the 1-hour, 4-hour, and daily candlestick patterns to confirm the entry or exit signals.

    Candlestick chart

    4. Heikin-Ashi Chart

    Best For: Trend followers who want cleaner charts

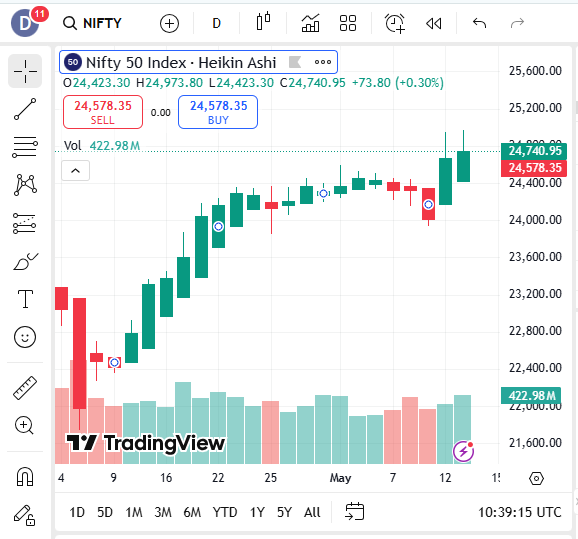
    Heikin-Ashi charts modify the traditional candlestick by averaging price data to filter out market noise and highlight trends.

    Use It When:

    • You want to stay longer in the trade without being stopped out from minor reversals.
    • Identifying strong bullish and bearish runs.
    • Filtering false breakout signals.

    Pro Tip:

    The Heiken Ashi candle should be paired with a momentum indicator such as MACD or RSI to confirm the strength of the trend before entering a trade.

    Heikin Ashi Chart

    5. Renko Chart

    Best For: Price-focused traders, breakout strategies

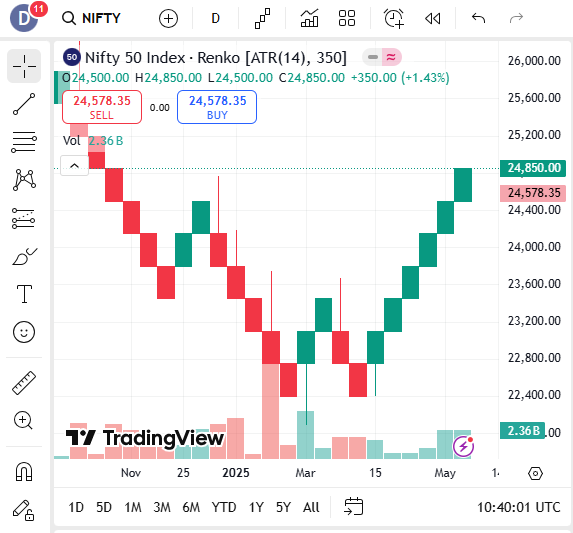
    Renko charts are built using price movement only, not time. A new brick forms only when the price moves a fixed amount, helping eliminate noise.

    When to Use:

    • If you want to prevent choppy price action and are looking at a clear trend.
    • When you build a rule-based breakout system.
    • For backtesting your strategies on cleaner data.

    Pro Tip:

    Combine Renko charts with moving averages to set up a trend-following system that gives fewer false signals.

    Renko chart

    6. Point and Figure (P&F) Chart

    Best For: Identifying support/resistance and breakout zones

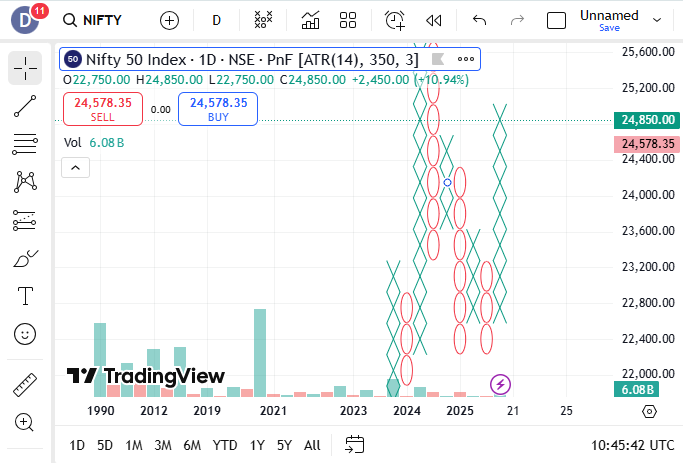
    P&F charts use X’s for rising prices and O’s for falling prices, ignoring time completely. They focus purely on significant price movement.

    Best Use Cases:

    • Analyzing long-term price movements or major breakouts. 
    • Looking for clean supply/demand zones. 
    • Want to avoid overtrading and focus on the big moves. 

    Pro Tip:

    Point and figure may be combined with horizontal counts for price targets—a concept unique to this chart type.

    Point and Figure chart

    Bonus: Common Overlays & Indicators for Any Chart

    Regardless of the chart type you use, overlays and indicators can improve your analysis:

    Common Overlays:

    • Moving Averages (MA, EMA): Help smooth out price and identify trends.
    • Bollinger Bands: Show volatility and overbought/oversold levels.
    • Ichimoku Cloud: Provides trend direction, support/resistance, and momentum.

    Popular Indicators:

    • Relative Strength Index (RSI): Identifies overbought or oversold conditions.
    • MACD (Moving Average Convergence Divergence): Measures momentum and trend direction.
    • Volume: Confirms the strength behind price movements.

    How to Choose the Right Chart Type

    Your GoalUse This Chart
    Quick overview of trendsLine Chart
    In-depth price analysisCandlestick or Bar Chart
    Filtering noise for clear trendsHeikin-Ashi, Renko
    Identifying breakouts/supportPoint and Figure, Renko
    Reducing emotional tradingHeikin-Ashi, Renko


    Final Thoughts:

    Each chart is supposed to tell a story, and sometimes that story varies with the chart type. Line charts are just simplifications. Candle charts show human emotions. Renko removes unnecessary noise. And Heikin-Ashi provides clarity in chaotic situations.

    Don’t get intimidated, attempting to master all chart variations all at once. Just start with candlestick charts, learn price action, and then choose more charts as per your choice of trading.

    Pro Tip: Real-time practice with chart types and timeframes using charting software like TradingView or ThinkorSwim is tremendously helpful.

    Want to Know More Details, Please Click Here

    join our free telegram channel
  • INTELLECT DESIGN ARENA Delivered 64% in 35 Days

    INTELLECT DESIGN ARENA Delivered 64% in 35 Days

    Intellect Design Arena

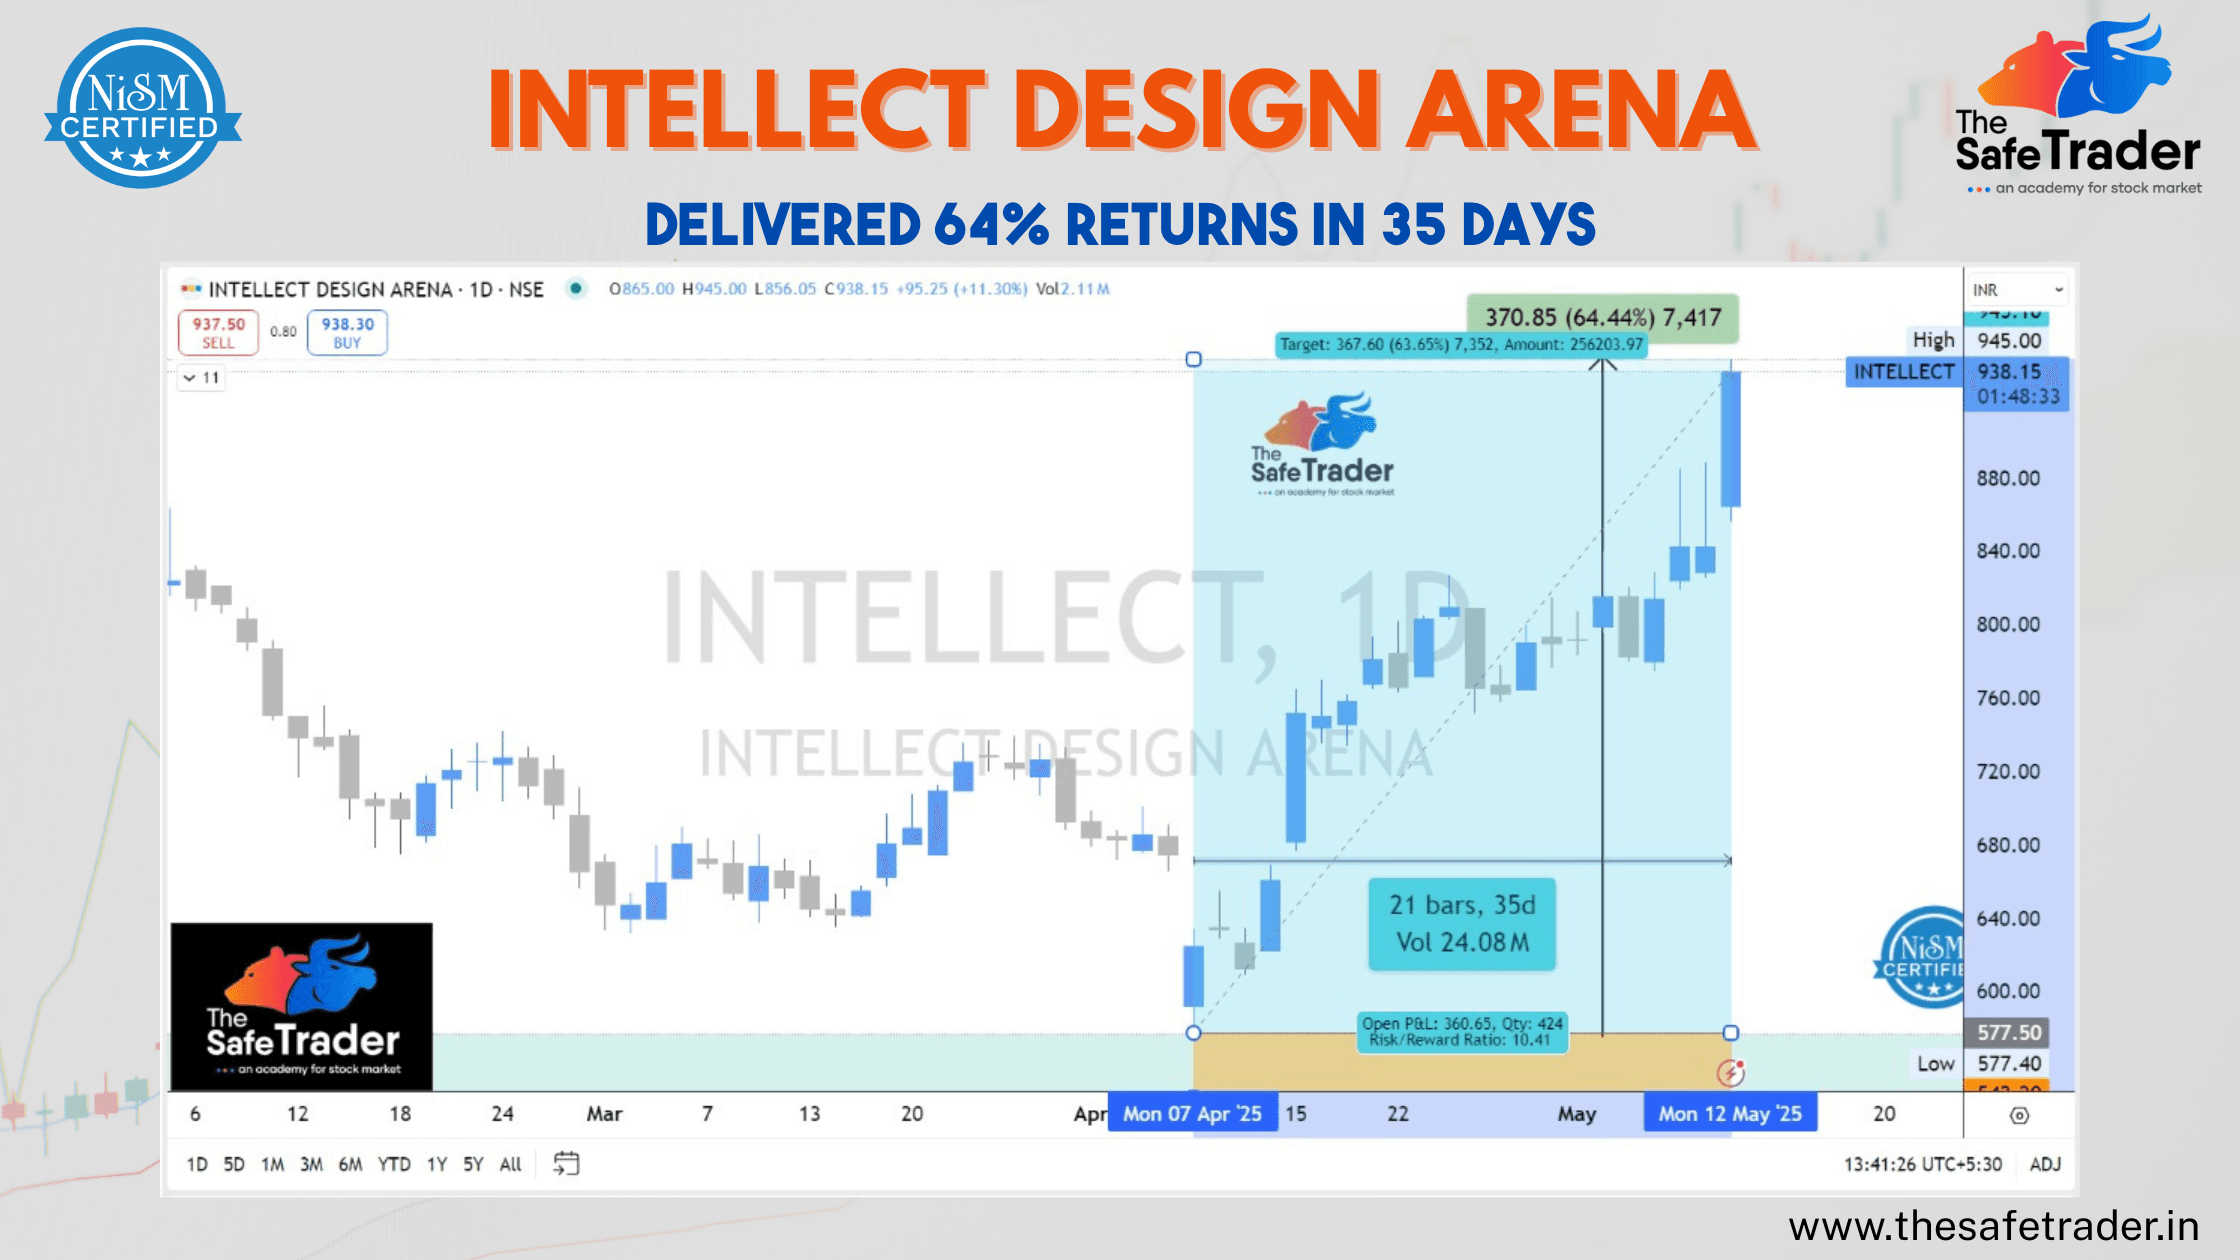
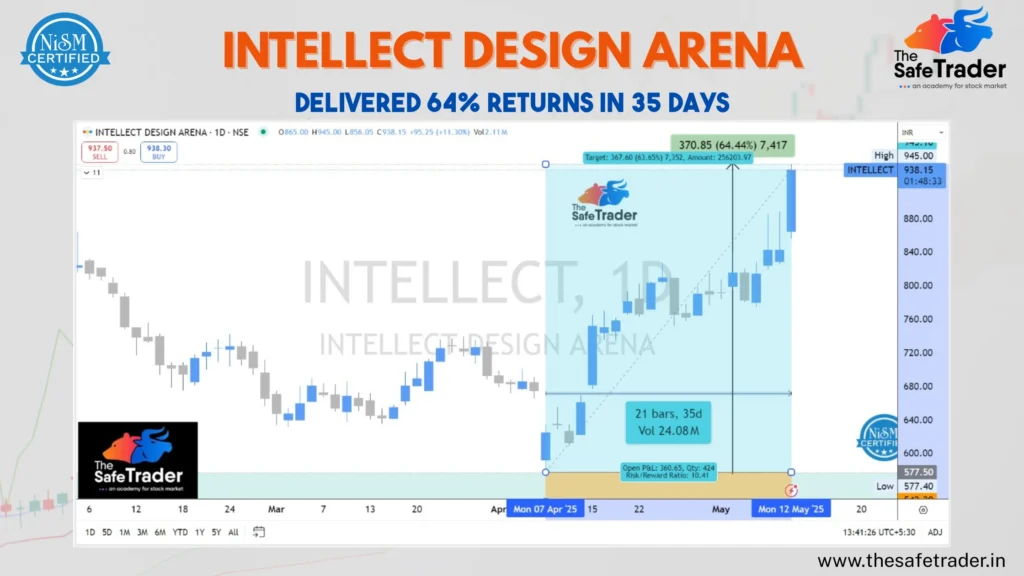
    Sometimes, the perfect opportunities arise in the stock market-for strategy, timing, and risk management. Another opportunity came along in INTELLECT DESIGN ARENA (NSE: INTELLECT)-an instant trade that gave returns of 64.44 per cent in just 35 days. 

    At The Safe Trader Academy, we teach students how to identify high-probability setups like this with real-time charts, volume analysis, and risk management. Let’s analyze this trade and see why it turned into a textbook breakout.

    Trade Overview

    • Stock Name: Intellect Design Arena
    • Entry Date: April 7, 2025
    • Entry Price: ₹577.40
    • Target/Exit Price: ₹938.15
    • Return: ₹370.75 per share
    • Percentage Gain: 64.44%
    • Holding Period: 35 Days (21 Trading Sessions)
    • Volume Traded: 24.08 Million
    • Risk/Reward Ratio: 10.41

    The chart showed a clear breakout with price action and volume alignment—exactly the kind of setup we train our students to recognize.

    Technical Breakdown

    ✅ 1. Breakout Confirmation

    April 7 witnessed the breakout of the stock price from a consolidation zone, closing on a strong bullish engulfing candle. It was a type of movement witnessed with a sharp rise in volume, the hallmark of institutional action. 

    ✅ 2. Volume Validity

    Volume maintained its upward trend during the upmove, further asserting the validity of the breakout. This helped traders continue holding on as prices rallied.

    ✅ 3. Trend Creation

    After the breakout, the stock went on to create higher highs and higher lows, ultimately sustaining the notion of a strong uptrend. The support zones stayed pleasantly firm throughout the trade.

    ✅ 4. Risk-Reward Ratio Management

    The trade had a risk/reward ratio of 10.41, minimizing downside with maximum upside potential-this is what smart swing trading is all about.

    Key Learnings for Traders

    Trade highlights several important lessons on tending to the market:

    • Enter on breakout after confirmation
    • Do use volume as a filter for decisions
    • Always stick to the preset risk-reward assignments
    • Avoid emotional exits; just stick to the setup

    At The Safe Trader Academy, we teach not just strategies; we teach the mindset and execution that lead to consistent results.

    The Safe Trader Way

    At The Safe Trader Academy, we don’t sell hype. We teach precision. Trades like this are the outcome of structured learning, live practice, and disciplined decision-making. Whether you’re new to the markets or looking to refine your edge, our academy is built for you. 

    Want to learn how to spot setups like INTELLECT before they break out?

    The INTELLECT trade was not luck—it was a preparation meeting opportunity. If you want to learn how to spot breakout setups like this and trade them with confidence,  join our next batch today.

    👉 Enroll today and become a smarter, safer trader.
    Join Our  Free Telegram channel
  • Top 10  Technical Indicators Every Trader Should Know

    Top 10  Technical Indicators Every Trader Should Know

    Technical Indicators

    In the world of trading, technical indicators serve as powerful tools to analyze price action, identify trends, and time entries and exits. Whether you’re trading stocks, forex, or cryptocurrencies, indicators provide a structured approach to interpreting market data.

    The article aims to explain technical indicators, what makes them useful; with advantages and limitations; and also the top 10 indicators every trader should know.

    What Are Technical Indicators?

    Technical indicators are mathematical calculations derived from price, volume, or open interest. They are primarily shown as visual overlays or charts that appear alongside the price of a given security. Traders use them to observe trends, reversals, momentum, and time their entry and exit.

    These indicators are an essential part of technical analysis, which considers historical price and volume data, rather than earnings or news type fundamental data.

    Why Do Traders Use Indicators?

    Identifying Trends: To ascertain whether the market is moving upward, downward, or is going sideways.

    Reversals: When a trend is about to exhaust itself or change direction.

    Confirming signals: To validate price patterns or breakouts.

    Entry and exit: Time indicators for entry and exit.

    Manage risk: Determine the volatility to set stop-loss accordingly.

    Advantages and Disadvantages of Technical Indicators

    Advantages

    • Simplifies complex market data
    • Helps remove emotional bias
    • Enables faster decision-making
    • Useful in both trending and ranging markets
    • Easily customizable and back testable

    Disadvantages

    • Lagging indicators react after the move starts
    • False signals can lead to losses
    • Over-reliance can ignore important fundamental or macroeconomic factors
    • Not always accurate in highly volatile or manipulated markets
    • Requires proper understanding to use effectively

    1. Moving Averages (MA)

    Category: Trend-Following

    What it does:

    Moving Averages eliminate the volatile behavior of past prices to offer the trend attitudinal direction over a specified time frame.

    Types:

    Simple Moving Average (SMA): Takes all closing prices throughout a given time period and divides by the number of time periods.

     Example: A 10-day SMA = Sum of last 10 closing prices ÷ 10

    Exponential Moving Average (EMA): EMA works the same way as the SMA with one difference: it puts more weight on recent prices, making it more sensitive to price changes.

    Common Uses:

    • Trend Identification: Whenever price is mostly above MA, then the trend is going up.
    • Crossover Signals:
    • Golden Cross: When a short-term moving average (e.g., 50-day) crosses above a long-term moving average (e.g., 200-day) → Bullish.
    • Death Cross : When short-term moving average crosses below long-term moving average → Bearish.

    Strengths:

    • Easy to use
    • Useful while trending 

    Limitations:

    • Lagged indicator (reacts after price has moved)
    • Gives false signals in ranging markets

    2. Relative Strength Index (RSI)

    Category: Momentum Oscillator

    What it does:

    RSI estimates the magnitude of recent price changes to assess whether a stock is overbought or oversold.

    Formula:

    RSI = 100 – [100 / (1 + RS)]

     Where RS = Average gain during the last N periods / Average loss during the last N periods (generally 14)

    Interpretation:

    • Price above 70: Overbought → Price must reverse down
    • Price below 30: Oversold → Price must reverse up
    • Divergence: When price makes a new high and RSI does not, it is a bearish divergence.

    Strengths:

    • Identifies potential reversal areas
    • Good for swing trading

    Limitations:

    • During a strong trend, an instrument can stay overbought/oversold for a significant period
    • Should be combined with other indicators (such as MACD or trendlines)

    3. Moving Average Convergence Divergence (MACD)

    Category: Trend + Momentum

    What it does:

    It measures the difference between two EMAs, usually the 12-period and the 26-period, and has a signal line, which is a 9-EMA of the MACD, so that buy or sell signals can be generated.

    Components:

    • MACD Line = 12-EMA – 26-EMA
    • Signal Line = 9-EMA of the MACD line
    • Histogram = MACD Line – Signal Line (Visual presentation of momentum)

    Key Signals:

    • MACD Synthesis: Crossing of the MACD line above or below the Signal line signifies respective buy or sell.
    • Zero Line Crossover: When the MACD Line crosses the baseline, trend confirmation ensues.

    Strengths:

    • One indicator combining trend and momentum
    • Able to detect trend reversals and divergences

    Limitations:

    • Lagging nature
    • False signals sometimes in choppy markets

    4. Bollinger Bands

    Category: Volatility

    What it does:

    Bollinger Bands comprise a middle band (20-period SMA) and two outer bands, usually set at ±2 standard deviations, signaling the level of market volatility.

    Interpretation:

    • Price near upper band → Overbought
    • Price near lower band → Oversold
    • Bollinger Squeeze/Contraction of bands → Low volatility precedent to a breakout
    • Breakout: Price closes out of the bands → Possibly new trend coming into play

    Strengths:

    • Perfect for spotting volatility and breakouts
    • Helps to identify the overbought/oversold state

    Limitations:

    • Doesn’t consider the direction of the breakout
    • False signals under low volumes

    5. Stochastic Oscillator

    Category: Momentum

    What it does:

    Compares a stock’s closing price with its range in the past time period—mostly 14 days.

    Formula:

     Stochastic Oscillator

    Interpretation:

    • Above 80: Overbought
    • Below 20: Oversold
    • Crossovers: %K crossing %D can signal a trend shift
    • Divergences signal weakening trends

    Strengths:

    • Reversals can be identified
    • Short-term trading responsive

    Limitations:

    • Would give false signals during strong trends
    • Best used in range-bound markets

    6. Volume

    Category: Confirmation tools

    What Is It?

    Volume measures the shares/contracts that have been traded during the defined time period.

    Why It Is Important:

    • The moves in prices are confirmed by the volume.
    • Price + High Volume = Strong Move
    • Price + Low Volume = Weak/False Move
    • Breakouts with heavy volume tend to last longer

    Related Tools:

    • On-Balance Volume (OBV): Cumulative indicator of volume
    • Volume Profile: Volume’s distribution at various levels of price

    Strengths:

    • Volume gives a real-time indication of strength behind moves
    • Must be taken into account while validating a trend or breakout

    Limitations:

    • Raw volume is not predictive
    • Volume patterns vary across asset classes

    7. Average True Range (ATR)

    Category: Volatility

    What it is:

    The ATR is a measurement of market volatility that calculates the average range of price a security has traded during the past set time period, most commonly 14 days.

    Formula:

    True Range = Maximum of: (High – Low)

    • |High – Previous Close|
    • |Low – Previous Close|

     ATR = 14-period moving average of True Range

    Utilization Cases:

    • Setting stop losses based on distance 
    • To alter positions’ sizes 
    • For identifying periods that are volatile and those that are stable

    Strengths:

    • Dynamic in terms of managing risk
    • Works on every sort of asset

    Disadvantages:

    • Does not provide a direction with respect to price
    • It is best to have trend indicators with it

    8. Fibonacci Retracement

    Category: Support/Resistance

    What it does:

    The retracement uses key Fibonacci ratios (23.6%, 38.2%, 50%, 61.8%, and 78.6%) to predict possible support or resistance areas.

    How to Use:

    • Find the swing high and swing low
    • Put the retracement levels on the price chart
    • Observe how the price reacts near these levels

    Application:

    • They can be used to project pullbacks during trends
    • Use them with a particular candlestick pattern or RSI/MACD for confirming signals

    Strengths:

    • Strongly respected by traders
    • Easy and intuitive

    Limitations:

    • It is subjective (depends on swing points chosen)
    • Often proposes multiple possible levels, so confirmation is required

    9. Parabolic SAR (Stop and Reverse)

    Category: Trend-Following

    What it does:

    Plots dots on the price chart to mark potential trend reversals and act as trailing stop-losses.

    Interpretation:

    • When dots are below the price: Bullish trend
    • When dots are above the price: Bearish trend
    • When dots flip from being above the price to below and vice versa: Trend reversal

    Strategy:

    • Trail the stop-loss with SAR
    • Use SAR in conjunction with another indicator like MACD or RSI for better confirmation

    Strengths:

    • Clear visualization for trend reversals
    • Best suited for determining stop-loss points

    Limitations:

    • Can be whipsawed in choppy sideways markets
    • Rent that price best trending markets

    10. Ichimoku Cloud

    Category: Multi-functional (Trend, Momentum, Support/Resistance)

    Function:

    Gives a comprehensive view of market sentiment and trend direction with five components.

    Components:

    • Tenkan-sen (Conversion Line): Short-term trend
    • Kijun-sen (Base Line): Medium-term trend
    • Senkou Span A & B (Kumo/Cloud): Future support/resistance
    • Chikou Span (Lagging Line): Confirms trend

    Interpretation:

    • Price above cloud → Bullish
    • Price below cloud → Bearish
    • Cloud color: Bullish (green) or Bearish (red)

    Strengths:

    • Multiple data points have been provided in one single window
    • Best for swing and long-term traders

    Limitations:

    • Complicated for beginners
    • May lag during fast-moving markets

    Can You Rely on Indicators to Make Profits?

    Yes — but with caveats.

    Indicators do not have the ability to foresee and tell you about the future. Instead, these indicators tell you about the last hour, day, month, or year, the market volumes, highs, lows, collars, open interest, prices, trends, and many more to help you make an informed decision. If you’re a successful trader, you’d never rely on one single indicator. Instead, you apply many indicators, look for confirmation, combine them with price action, risk management, and analysis of market context.

    Indicators work best when:

    – Two or more indicators are used in confluence (agree)

    – Clear rules for risk management are established to accompany them

    – Back tested and tailored to fit the trader’s framework

    Yet one must avoid extremes in reliance. For in reality, there is no single indicator that is correct in every condition ever faced by an active market. Hence, trading surely boils down to strategy and discipline and adaptability with the existing conditions and not merely technical signals.

    Final Thoughts

    Technical indicators are important market analysis tools but clearly not in the realm of certainty. Knowing how each indicator works, measuring factors, and when to use it is the main pillar of the trade strategy building. Those top 10 indicators should be a solid building block with which further trade strategy building or refining can continue.

    Pro Tip: Pick 2 or 3 indicators that go well together, test them on historical data, then build your system from there with confidence!

    Want to Know More Details, Please Click Here

    Join Our  Free Telegram channel
  • Dow Jones: A Trader’s Guide to US30 Weightage

    Dow Jones: A Trader’s Guide to US30 Weightage

    Dow Jones

    The Dow Jones Industrial Average (DJIA), popularly known as the Dow or US30 on various trading platforms, is certainly one of the most iconic and widely recognized indices among traders. Nonetheless, many traders will admit to not having the slightest idea of how the index works or of how the movement of an individual stock would affect the index. This is all the more crucial to day traders, swing traders, and position traders who use technical or fundamental strategies based on the Dow movement. 

    This blog  will explain exactly what Dow really means, how stocks are weighted, and what this means for a trader trying to build an edge. 

    What is the Dow Jones?

    The Dow Jones Industrial Average, or simply the “Dow,” was created in 1896 by Charles Dow and Edward Jones. It initially comprised just 12 companies, evolving over time into a 30-stock index supposedly meant to represent the broader U.S. industrial economy—yet ironically, not many today are really industrial companies.

    The DJIA is often referenced as an indicator of general market sentiment and economic health. Blue-chip stocks are included from sectors like technology, healthcare, finance, consumer goods, among others.

    Quick facts about the Dow Jones:

    • Founded: 1896 by Charles Dow and Edward Jones
    • Number of Constituents: 30 large-cap U.S. companies
    • Ticker Symbols: DJIA, US30, ^DJI (Yahoo Finance), INDU (Bloomberg)
    • Index Type: Price-weighted
    • ETF Tracked: $DIA (SPDR Dow Jones Industrial Average ETF)
    • Exchanges: New York Stock ExchangeNasdaq
    • Market cap: US$19.5 trillion; (as of December 31, 2024)
    • Operator: S&P Dow Jones Indices
    • Trading symbol: ^DJI; $INDU.DJI; DJIA

    The Dow does not track the overall market like the S&P 500, rather, it cherry-picks the cream of the crop blue-chip companies that are deemed leaders in their industry and considered stable with consistent performance.

    Price-Weighted: What Makes It Different

    Most modern-day indices are market-cap weighted, implying that the larger the company, the more influential it is. The Dow, though, is price-weighted, and thus the more expensive a stock, the more it moves the index; the market capitalization of the company is irrelevant here.

    Example:

    UnitedHealth (UNH) at $500 can move certain levels in the Dow that Apple (AAPL) at $180 cannot, even though Apple is 3 times bigger in terms of market cap.

    A 1% move in the price of UNH shares will have a lot more effect on the index than a 1% move in CSCO or INTC. 

    This can cause distortion. A $10 increase in UNH price would add around 70 points to Dow, whereas a similar $10 increase in AAPL price adds only ~36 points.

    Top 10 Weighted Stocks in the Dow (2025)

    Below are the most influential components of the Dow based on recent price data (as of May 2025). Keep in mind these weights change slightly with price fluctuations:

    RankCompanyTickerPrice (Approx.)Influence (Weight %)
    1UnitedHealth GroupUNH$500~9.5%
    2MicrosoftMSFT$420~8.2%
    3Goldman SachsGS$370~7.3%
    4Home DepotHD$330~6.5%
    5McDonald’sMCD$290~5.7%
    6AmgenAMGN$270~5.3%
    7CaterpillarCAT$260~5.1%
    8AppleAAPL$180~3.5%
    9BoeingBA$170~3.3%
    10IBMIBM$160~3.1%


    Trading Implications of Price Weighting

    If you engage in Dow (US30) futures or CFDs, including options, knowing price-based weighting is crucial for risk management and strategy formulation.

    Traders’ Opportunities:

    Earnings Season: Focus on high-priced stocks like UNH, GS, or MSFT; unexpected events can sway the Dow quite significantly.

    News Catalysts: One upgrade or downgrade to a high-weight stock sends the entire index in one direction or the other.

    Correlation Tracking: Occasionally, the Dow rises with some 20 stocks down, just because a few of them are heavily weighted in the index. 

    Risks and Misinterpretations:

    • Simply relying on Dow performance may give the impression of the entire market movement.
    • Since the DowWeight and S&P 500 method of calculation do differ, there might be an instance when Dow is up while S&P 500 and Nasdaq are down. 
    • Too much exposure to key stocks can deceptively increase correlation risk in your portfolio.

    A Sector Breakdown of the Dow

    It boasts a variety of companies from a spectrum of industries, some sectors are more represented than others. As of 2025, here is a rough breakdown:

    Technology: Apple, Microsoft, Intel, IBM, Salesforce, and Cisco

    Healthcare: UnitedHealth, Johnson & Johnson, Amgen, and Merck

    Financials: Goldman Sachs, JPMorgan Chase, and American Express

    Industrials: Boeing, Caterpillar, 3M, and Honeywell

    Consumer: McDonald’s, Walmart, Procter & Gamble, Nike, and Coca-Cola

    Note: The Dow has far lesser exposure to technology than the Nasdaq-100, and this directly affects how the index reacts to tech-sector volatility.

    Some Key Takeaways For Traders and Investors

    • The Dow is price-weighted and not market cap-weighted; hence, high-priced stocks dominate.
    • Awareness of dominant issues helps in predicting the index reaction to earnings, news, or economic events.
    • The Dow, by itself, is a useful benchmark but does not fully depict the market; thus, it is often suggested to use the Dow with S&P 500 and Nasdaq.
    • Risks must be managed whereby concentration risks are hidden because of too much weight of a few dominant stocks.

    Useful Tools for Dow/US30 Traders

    Some tools and resources useful for following and analyzing the US30:

    • TradingView – Real-time US30 charting and technical analysis
    • Yahoo Finance / Bloomberg – Component stock data and news
    • DIA ETF Chart-SPDR Dow Jones Industrial Average ETF
    • Earnings Calendar-Points to dates for high-weighted components

    Final Thoughts

    Even though Dow Jones looks like a simple index, under its unique price-weighted design lie certain opportunities and pitfalls. Hence an individual trader or investor would have to gain an understanding of what stocks actually drive the Dow’s movement for a piece of constrained market awareness.

    The US30 continues to retain favor with the intraday and swing traders, being affected by volatility, liquidity, and the psychological factor of world finance. Just make sure you don’t treat it like one other index-because it isn’t.

    Want to Know More Details, Please Click Here

    Join our free telegram channel

  • Bombay Stock Exchange: A Beginner’s Guide

    Bombay Stock Exchange: A Beginner’s Guide

    Bombay Stock Exchange

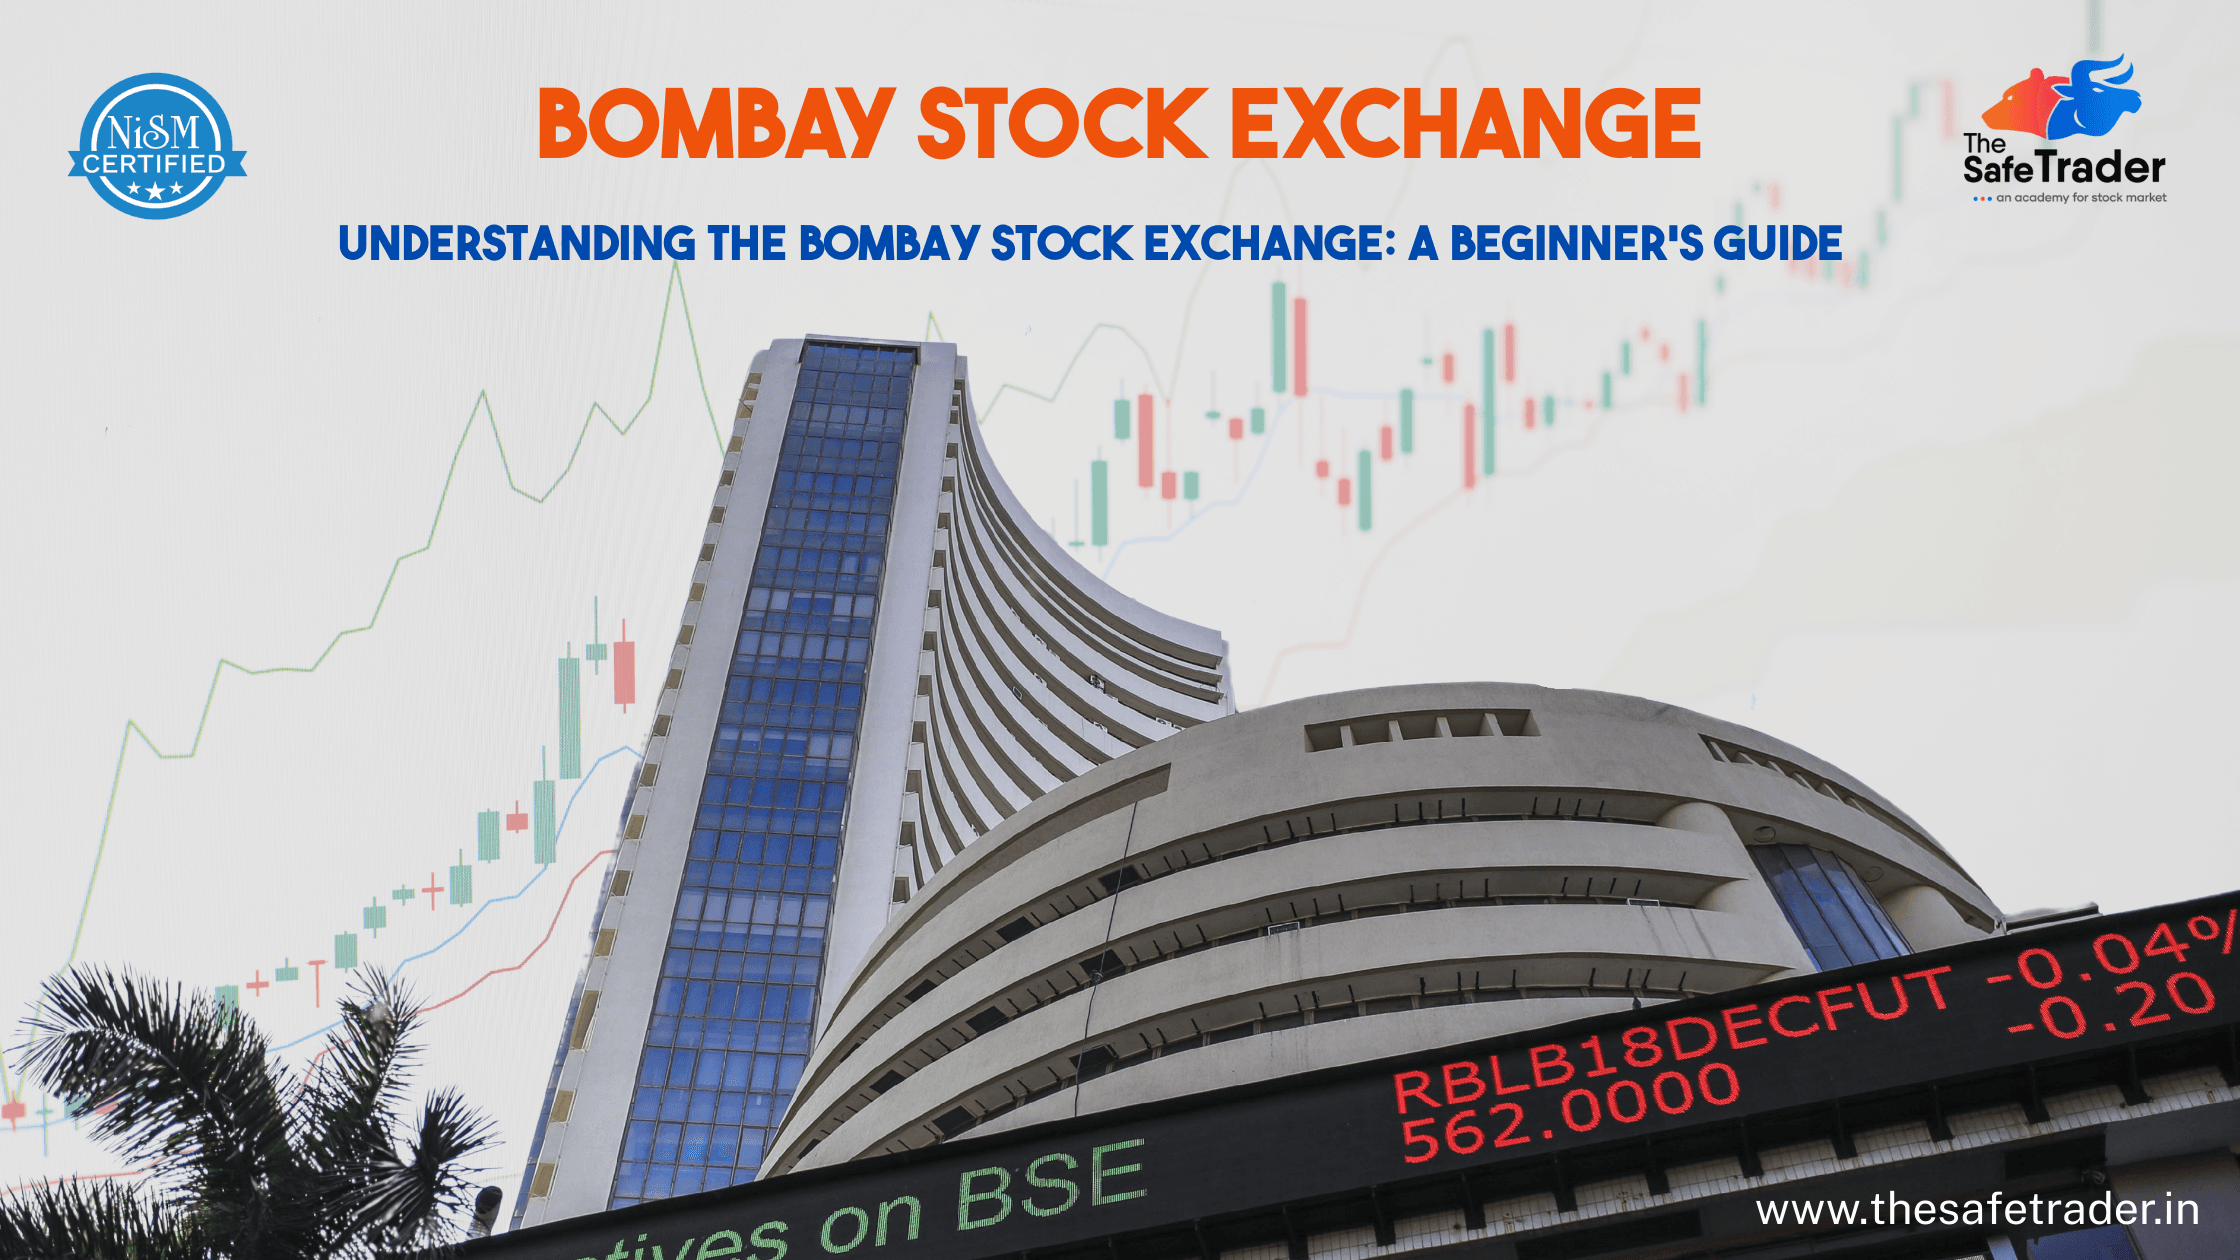
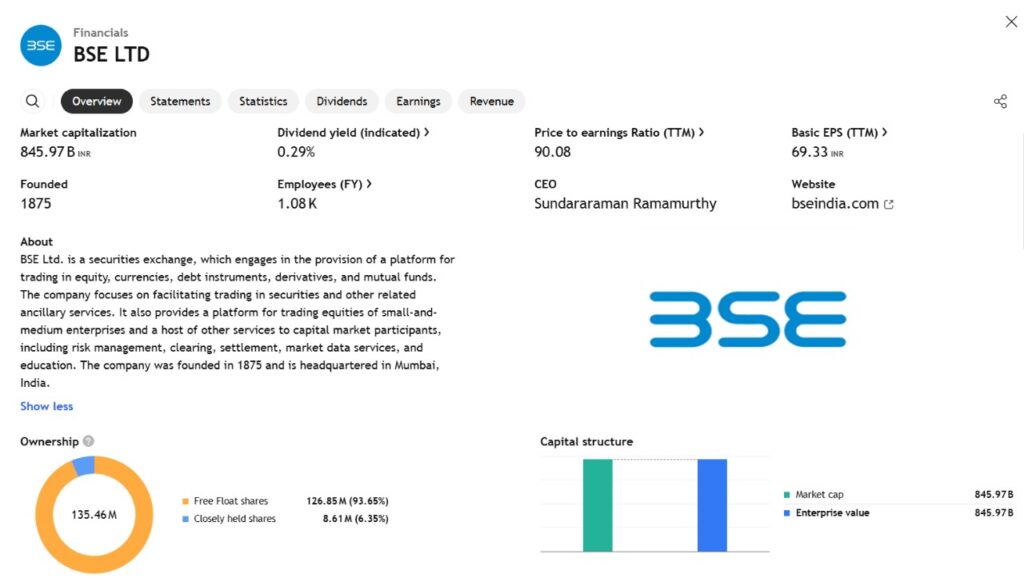
    BSE, the first-ever stock exchange in Asia, was established in 1875. It is also the first in the country to be granted permanent recognition under the Securities Contract Regulation Act, 1956. It is the Fastest Stock Exchange in the world with a speed of 6 microseconds and is one of India’s leading exchange groups. In 1986, the Co-developed the S&P BSE SENSEX index, giving the Co. a means to measure the overall performance of the exchange. In 2017, it became the first listed stock exchange in India.

    About BSE

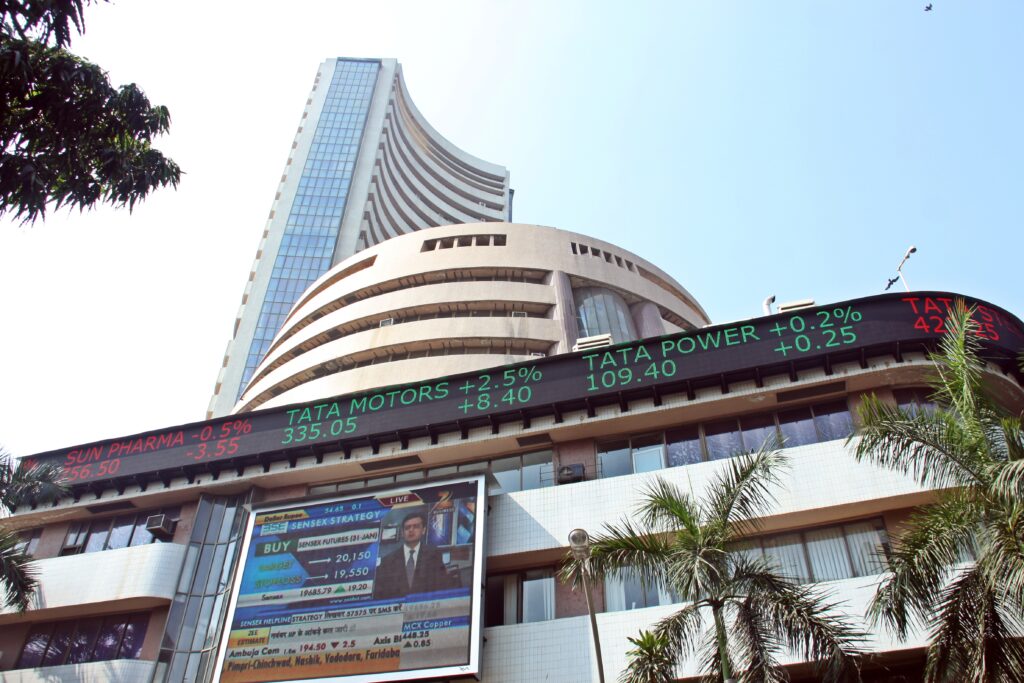
    Bombay Stock Exchange (BSE Ltd) is an Indian Stock Exchange located at Dalal Street in Mumbai. The Co. facilitates a market for trading in equity, currencies, debt instruments, derivatives, and mutual funds.

    About BSE

    BSE Ltd. Stock Pros

    Debt-Free company

    • Being devoid of any debt, the BSE remains unaffected financially during crises, bolstering its sustainability from the long-term perspective.

    Strong Quarterly Outlook

    • Good quarterly-derived results and positive business momentum are expected in the coming quarters.

    Solid Growth in Profits

    • Strong growth in profits with a CAGR of 64.1% in the last 5 years-as an indication of distributive income growth.

    Good Dividend Payout

    • Maintains a dividend payout ratio of 41.1%, indicating that investors are consistently rewarded.

    BSE Ltd. Stock Cons

    High Valuation

    • Currently, the stock trades at a price-to-book ratio of 20.4, possibly suggesting that the stock is overpriced compared to its net asset value.

    Peer Comparison for BSE:

    It compares BSE with other companies belonging to the same niche-i.e., financial services. BSE takes the lead in all the important key statistics:

    1. Highest Quarterly Net Profit: ₹493.67 crore, miles away from competition.
    2. Strong Sales Growth: With sales of ₹916.97 crore for the quarter, BSE is ahead of the others, having witnessed a 70.09% growth.
    3. High Return on Capital Employed (ROCE):43.54%, indicating optimal capital usage.
    4. Premium Valuation: BSE is trading at a P/E of 68.38, implying very strong investor confidence that glances over the 0.23% dividend yield.
    5. Market Cap Leader: ₹90,059 crore, underlining the biggest company in this group by size.

    BSE Financial Highlights 

    1. Revenue Growth

    • Sales have jumped from ₹228 crore in March 2022 to ₹917 crore in March 2025.
    • This steady rise shows a strong expansion in day-to-day operations and a greater market share being absorbed on the exchange platform.

    2. Operating Performance

    • Operating Profit (PBIT) has risen steeply from ₹85 crore in March 2022 to ₹555 crore in March 2025.
    • With such heavy dominance in revenue growth, there is further enhancement in the Operating Profit Margin (OPM%), gradually expanding from 37% to 60%, which means that operationally they are becoming even more cost-efficient and profitable. 

    3. Net Profit & EPS

    • Net Profit has increased from ₹72 crore (Mar. 2022) to ₹494 crore (Mar. 2025).
    • EPS rose from ₹5.51 to ₹36.52 in the same period, signaling high returns to shareholders.

    4. Exceptional Quarter – June 2023

    • Notably, in June 2023, BSE recorded an extremely high ‘Other Income’ of ₹430 crore, which severely swelled their PBT to ₹516 crore and Net profit to ₹440 crore.
    • Such a spike might be because of a 1 time gain or some non-operating income usage like investments or asset sales. 

    5. The Leveraging in Action

    • Costs have been kept under control while the revenues have surged, particularly from June 2023 onwards.
    • This does show operating leverage, wherein fixed costs stayed consistent while surging revenue led to increased profitability.

    Profit & Loss statement of a BSE from FY 2014 to FY 2025

    • Sales and profits have increased significantly, with a huge increase in sales from ₹485 Cr to ₹3,212 Cr and net profits from ₹160 Cr to ₹1,322 Cr.
    • Operating Profit Margins have been kept very strong, with 55% recorded in 2025.
    • A pretty strong growth has been witnessed lately by the company, with 102% sales growth in TTM and 189% profit growth in TTM.
    • Return on equity has improved; it was 34% in the last year, which is an indicator that the capital has been properly utilized.
    • Earnings PerShare increased from ₹4.34 to ₹97.94 during the period.
    • Dividend payout has been a bit erratic, lower in recent years (23% in 2025).

    The stock has done really well, giving 137% returns in the past one year alone and 120% CAGR over 5 years.

    BSE Balance Sheet Analysis (Mar 2014 – Mar 2025)

    Strong Asset Build-up:

    • Assets witnessed a healthy growth, from ₹4,066 crore (2014) to ₹10,342 crore (2025).

    Steady Increase in Reserves:

    • From ₹2,366 crore to ₹4,397 crore, reserves stand to show an increasing trend in retained earnings.

    Debt-Free:

    • In keeping with BSE’s style of discipline, serially little or almost nil borrowings have been maintained and are considered a safe avenue.

    Being Operation-Linked, Other Liabilities Rise:

    • A good rise in other liabilities has been witnessed in 2024-25, most probably due to market volumes and operations.

    Good Investment Portfolio:

    • Investments keep on rising and stand at ₹2,845 crore, indicating efficient usage of funds.

    Growth in Infrastructure: 

    • An increase in CWIP (₹41 crore in 2025) means progressing infrastructure or technology upgrades.

    Financially Sound and Low-Risk: 

    • The Balance Sheet gives a picture of a conservative, stable, and well-managed organization.

    Cash Flows and Ratios of  BSE Ltd.

    Cash Flows (₹ in Crores)

    1. Cash from Operating Activity:
      • Volatile over the years. Highest in Mar 2024: ₹2,842 Cr, showing strong core operations.
      • Negative in multiple years (e.g., 2015, 2016, 2018), indicating operational stress at times.
    2. Cash from Investing Activity:
      • Mostly negative, especially in 2022–2025, indicating heavy investments in assets or acquisitions.
    3. Cash from Financing Activity:
      • Frequently negative, suggesting debt repayment or dividend payouts.
      • Positive only in a few years (e.g., 2018, 2022).
    4. Net Cash Flow:
      • Large fluctuations; strong positive in Mar 2017: ₹827 Cr, Mar 2024: ₹1,622 Cr, but negative in Mar 2025: ₹-563 Cr.

    Cash Flows (₹ in Crores)

    Cash From Operating Activities:

    • It shows volatility throughout the years, having hit the major peak in March 2024 of ₹2,842 Cr because of strong core operations.
    • Negative in the years 2015, 2016, and 2018, signifying that the operations sometimes faced stress within the time.

    Cash From Investing Activities:

    • Majorly negative especially during 2022–2025, indicating heavy outflow for investments in fixed assets/acquisition.

    Cash From Financing Activities:

    • Mostly negative, indicating repayment of debt or dividend payments.
    • Positive, however, in a few years, such as 2018 and 2022.

    Net Cash Flow:

    • Fluctuated greatly; strongly positive in Mar 2017: ₹827 Cr, Mar 2024: ₹1,622 Cr, but negative in Mar 2025: ₹-563 Cr.

     Key Financial Ratios

    1. Cash Conversion Cycle (CCC):
      • Generally low and efficient, especially in Mar 2022: 28 days, and improving again in Mar 2025: 35 days.
      • Reflects efficient working capital management.
    2. Working Capital Days:
      • Negative throughout, indicating high current liabilities or strong supplier credit terms.
      • Deepest in Mar 2022: -1,148 days, improving to -279 days in Mar 2025.
    3. ROCE (Return on Capital Employed):
      • Consistent growth, peaking at 44% in Mar 2025, showing highly efficient capital usage.
      • Just 5–10% in early years, with a major rise after 2017.

    Shareholding Pattern  for a BSE Ltd:

    1. Foreign Institutional Investors (FIIs):
      • FIIs’ stake grew significantly from 0% in Jun 2022 to 16.78% in Mar 2025.
      • Indicates increasing global investor interest in the stock.
    2. Domestic Institutional Investors (DIIs):
      • DIIs had fluctuating but growing interest, increasing from 12.04% (Jun 2022) to 12.33% (Mar 2025).
    3. Public Shareholding:
      • Declined from 61.81% in June 2022 to 48.78% in Mar 2025.
      • Reflects possible movement of shares from retail/public to institutional investors.
    4. Others Category:
      • Gradually decreased from 26.14% in June 2022 to 22.11% in Mar 2025.
    5. Number of Shareholders:
      • Increased steadily from 4.46 lakh in June 2022 to 6.68 lakh in Mar 2025.
      • Suggests growing retail participation or interest in the stock.

    Conclusion 

    The Bombay Stock Exchange did stretch its arms far from its humble 19th-century beginnings. Today it plays the important role of raising capital, offering investment opportunities, and serving as the economic barometer. The trick of the trade here is that whether you are an inexperienced investor or an experienced trader, knowing how BSE operates will empower you with tools and know-how to pursue the opportunities in India’s dynamic financial landscape.

    As India proceeds forward to become one of the largest economies in the world the future of BSE will remain full of opportunities for innovation, investment, and economic development.

    Want to Know More Details, Please Click Here

    Join Our Free Telegram Channel

  • Ku Coin BTC Reserves Collapse 77% as 14K Coins Flee

    Ku Coin BTC Reserves Collapse 77% as 14K Coins Flee

    Ku Coin

    This week, the Cryptocurrency world was shaken after a series of data revealed massive Bitcoin outflows from KuCoin. During the recent days, over 14,000 BTC have reportedly been withdrawn from the exchange, bringing about a 77% decline in its Bitcoin reserves. This development has provoked concerns about a possible liquidity crisis and, hence, uncontrolled questions about user trust, regulatory pressure, and the bearing on centralized exchanges at large.

    What Triggered the Mass Exodus?

    Reserves of KuCoin have sharply declined after the exchange’s rough phase. KuCoin was charged, earlier in 2024, by the U.S. Department of Justice for allegedly failing to maintain an effective anti-money laundering program. Apart from being subject to such legal risk, however, regulators began regulating centralized platforms with a tighter grip, and users began thinking hard about where to put their assets. 

    What happened, as a result? A withdrawal wave, especially from the institution and long-term holders. On-chain data states that the packet of KuCoin BTC reserves plummeted from about 18,000 BTC to below 4,000 BTC, while it was at its lowest level in many years.

    A Crisis of Confidence?

    While KuCoin maintains that operations remain normal, if there is so much BTC leaking out, then there’s something wrong. The users seem to have begun doubting the platform’s ability to handle risk, uphold security for the funds, and act in accordance with global regulations. 

    This resembles what has happened during other exchange collapses, most famously the case of FTX in 2022, where the reserve drain came to fore as an early indicator of liquidity woes. Nothing so far points straight to KuCoin being insolvent; however, as it stands, the situation is unsettling enough to disturb investors.

    The Liquidity Squeeze Scenario

    At present, KuCoin finds itself bearing a real threat of liquidity strain in times of market volatility and hence, less BTC on hand. Suppose fast price surges or price drops hit Bitcoin markets and rushes users to withdraw; then handling orders or withdrawing processing quickly may become an issue for the exchange.

    This gets worse if the exchange depends on borrowed liquidity or settlement on a time lag. In times even worse, from a bad-case perspective, we could experience:

    • Delays in withdrawing BTC
    • Huge spreads and slippage on big orders
    • Temporary trade halts or “maintenance” operations

    Self-Custody on the Rise

    The KuCoin affair is just one member of a much larger client consciousness: a shift toward self-custody. As users get more acquainted with the risks associated with central exchanges, they have started increasing the adoption of hardware wallets and decentralized platforms.

    While blockchain is built on trustless systems, centralized platforms instill a single point of failure. Events like this act as an acceleration toward a more decentralized future, where users can control their assets and reduce counterparty risk.

    What to Watch Next

    For investors and traders, this is a crucial time to stay alert. Here’s what to monitor:

    1. KuCoin’s response: Will the exchange publish a real-time proof-of-reserves audit?
    2. Market contagion: Will this trigger a ripple effect on other centralized platforms?
    3. Regulatory impact: Will this event pressure regulators to mandate transparency in exchange reserve holdings?

    Final Thoughts

    That 77% collapse of KuCoin’s BTC reserves should not merely be taken as a headline but should be viewed as a red flag. Given the present state of affairs (whether it is the beginning of a broader liquidity crisis or simply some kind of user-driven shift toward self-custody), it again stands as a reminder to crypto holders about the number one rule: “Not your keys, not your coins.”

    As usual, research hard, stay informed, and don’t ever leave more funds in an exchange than you are willing to lose.

    Want to Know More Details, Please Click Here

    Join Our Free Telegram Channel


  • Forex Trading for Beginners: A Step-by-Step Guide

    Forex Trading for Beginners: A Step-by-Step Guide

    Forex Trading for Beginners

    The Global Forex Market offers exciting opportunities to trade major currencies and profit from exchange rate movements. But if you’re a beginner in India, entering the world of forex trading can feel overwhelming—especially with legal regulations and risks involved.

    This blog is your step-by-step guide to understand forex trading and start your journey safely and legally within India’s regulatory framework.

    What Is Forex Trading?

    Forex trading, also known as currency trading, is the simultaneous buying of one currency and selling of another. Currencies are traded in pairs, such as USD/INR or EUR/USD. The objective of a forex trader is to earn a profit by predicting the fluctuations in exchange rates.

    For example:

    • Buying USD/INR: If you believe that the Indian Rupee (INR) will weaken against the US Dollar (USD), you would buy the USD/INR pair.
    • Selling USD/INR: On the other hand, if you believe that the Indian Rupee will strengthen, you may sell the USD/INR pair.

    Traders use various tools and strategies to predict currency price movements, including technical analysis and fundamental factors such as interest rates, inflation, and global geopolitical events.

    Is Forex Trading Legal in India?

    Yes, But With Conditions, The Reserve Bank of India (RBI) and the Securities and Exchange Board of India (SEBI) allow Indian residents to trade currency derivatives only on SEBI-registered Indian exchanges such as:

    – NSE (National Stock Exchange)

    – BSE (Bombay Stock Exchange)

    – MCX-SX

    Only four currency pairs that are INR-based are permitted for trading on these exchanges:

    – USD/INR

    – EUR/INR

    – GBP/INR

    – JPY/INR

    ⚠️ Warning: Trading forex pairs without INR (like EUR/USD or GBP/JPY) through foreign brokers is prohibited under the FEMA Act for retail investors in India. Heavy punishments can be imposed on offenders.

    Learn everything about trading  from scratch

    Step-by-Step Guide to Start Forex Trading in India

    Step 1: Learn the Basics of Forex Trading

    Before you begin trading, it’s crucial to understand the following:

    • How Currency Pairs Work: Recognize the differences with currency pair quotations and how to interpret those movements.
    • Factors Influencing Exchange Rates: Interest rates, inflation, political stability, and global events are among the key factors that affect currency fluctuations
    • Trading Strategies: Popular strategies would range from trend-following, scalping, to range trading.
    • Chart Patterns and Indicators: Technical indicators and chart patterns allow price movements prediction.
    • Risk Management: Concepts that allow you to actually manage risk, including stop-loss orders, leverage, and position sizing.

    Step 2: Choose a SEBI-Registered Broker

    You will need a reliable forex broker to execute your trades. Look for brokers that are regulated by SEBI and provide trading on Indian exchanges like NSE or BSE. Ensure that they offer the currency pairs you wish to trade (USD/INR, EUR/INR, etc.).

    Step 3: Open a Demat Account

    To trade forex on Indian exchanges, you need to open a Demat account. A Demat account is necessary to hold your financial assets in electronic form and facilitate the buying and selling of currency derivatives.

    Looking to open a Demat account?


    You can easily open a PUPrime Demat Account using our link, and get support to guide you through the entire process, ensuring you start on the right track.

    Step 4: Practice with a Demo Account

    Start paper trading by practicing on a demo account to:

    • Learn order placement (buy/sell)
    • Get familiarized with trading platforms like Kite from Zerodha or Upstox Pro
    • Learn stop-loss and take-profit

    Backing yourself with virtual funds is the need of the hour before laying real money.

    Step 5: Fund Your Trading Account

    Fund your trading account/linking your bank account for this purpose once you are ready for live trading in the market. Keep a small amount to trade with (1,000 to 5,000 rupees) just to safeguard against loss during your learning process. 

    Step 6: Initiate Your First Trade

    Trade in 100 per currency pair, for example, USD/INR…Choose if you want to buy or sell this currency pair depending on your analysis. Check out the key factors to consider:

    – Lot size: Minimum contract value of currency futures is US$1,000.

    – Margins: Margin of around 3-5 percent of the value of trade is required to be deposited by the broker.

    – Expiry: Just like with stock derivatives, currency contracts expire on a monthly basis. 

    Step 7: Begin With Your Risk Management

    Forex trading success is all over making money, but protecting capital is just as important. Always:

    – Use a stop loss to limit your losses

    – Risk no more than 1-2% of your capital on any single trade

    – Refrain from emotional or revenge trading Get it?

    Benefits of Forex Trading in India

    • Low capital requirement to get started
    • High liquidity and flexibility (you can trade small lot sizes)
    • Diversification beyond stocks and mutual funds
    • Access to global economic trends

    Risks You Should Know

    • High volatility and unpredictable movements
    • Emotional decision-making leading to losses
    • Legal risks if using unregulated foreign brokers
    • Potential misuse of leverage

    Why Choose The Safe Trader?

    At The Safe Trader, we prioritize your safety and success in the forex market. Our team offers personalized trading guidance, real-time signal alerts, and custom strategy sessions tailored to your goals. We help you navigate the market confidently with risk management tools and continuous support, ensuring you’re never trading blindly. Join us to trade smarter, not riskier.

    Final Thoughts

    Forex trading can be a profitable and intellectually rewarding journey—but only if approached with knowledge, discipline, and legal compliance. For Indian residents, it’s crucial to trade only on recognized exchanges and platforms that deal in INR-based currency pairs.

    Let The Safe Trader guide you toward a safe, smart, and successful trading journey.

    Call to Action:

    Ready to begin? Contact us today to book your free consultation or join our Telegram community for daily trading insights.

    FAQs: Forex Trading for Beginners in India

    Q1. Can I trade forex legally in India?

    A: Yes, but only INR-based pairs (like USD/INR) via SEBI-regulated platforms.

    Q2. Can I use foreign brokers to trade EUR/USD or GBP/USD?

    A: No, it’s illegal for retail investors under FEMA rules.

    Q3. Is forex trading risky?

    A: Yes, like all trading, it involves risk. Leverage and market volatility can lead to losses.

    Q4. How much money do I need to start?

    A: You can start with as little as ₹1,000–₹5,000 depending on the broker and margin requirements.

    Q5. Can I trade forex on weekends?

    A: No, forex markets are closed on weekends. Trading happens Monday to Friday.

    Q6. How do I learn more?

    A: Join our Free Trading Orientation or contact us directly at www.thesafetrader.in

    Looking to Open a PU Prime Account?

    ✅ Get started today with The Safe Trader Academy

    📈 Open PU Prime Account:
    https://in.puprime.com/forex-trading-account/?affid=60590

    📈 Verify Your Account:
    Make sure to complete all necessary verification steps to ensure your account is active and compliant with regulations. You need Aadhar Card & Bank Statement.

    📊 Download MT4 Android App
    https://drive.google.com/file/d/1-_tRSHoX6BSUmCDkJCOhOSUT3E1na_pq/view?usp=sharing

    📊 Download MT5 Android App
    https://drive.google.com/file/d/1YTzaNHhNgWmhKdx5XcgmQLR7bHyJqxfq/view?usp=sharing

    📞 Call/WhatsApp Now: +91 9297506666

    Start Your Forex Journey with Us! 🚀

    Join our free telegram channel
  • List of Stock Exchanges in India: Cash and Commodity

    List of Stock Exchanges in India: Cash and Commodity

    List Of Stock Exchanges in India

    India’s financial systems are powered by strong, well-established exchanges where millions of transactions take place daily. These markets go all the way from stocks to agricultural produce and from retail investors to institutional giants, providing an organized platform of investment, hedging, speculation, and price discovery.

    This blog dissects the two major pillars of India’s exchange infrastructure-Cash Market (Equity Market) and Commodity Market-wherein the leading exchanges are highlighted as operating within each segment.

    Cash Market: The Foundation of Equity Investment

    Cash markets or equity spot markets are those where securities say stocks are exchanged for immediate delivery. In the cash market, ownership of shares is transferred and the payment is settled within a very short duration, normally T+1, where T is the date of the transaction.

    Cash market transactions are important for the long-term creation of wealth by providing an opportunity to invest in companies, earn dividends in return, and strengthen the portfolio.

    National Stock Exchange (NSE)

    NSE

    Website: nseindia.com

    Inaugurated: 1992

    Market Cap: Among the top exchanges in the world

    Key Index: Nifty 50

    The NSE revolutionized Indian capital markets by introducing an electronic limit order book (LOB) trading system. With a focus on automation, transparency, and investor protection, NSE quickly became India’s largest stock exchange.

    Key Features:

    • Advanced trading technology
    • High liquidity and tight bid-ask spreads
    • Multiple segments including equity, derivatives, currency, and debt
    • Emphasis on transparency and investor protection

    Products Traded on NSE:

    • Equities (stocks)
    • Equity derivatives (futures and options)
    • Currency derivatives
    • Debt instruments
    • ETFs and mutual funds

    Nifty 50 index is a measure of India’s economic health, and tracks the top 50 companies across critical sectors.

    BSE (Bombay Stock Exchange):

    BSE

    Website: bseindia.com

    Founded: 1875 (Oldest in Asia)

    Key Index: SENSEX

    BSE was formed in a time when trading was being held under a Banyan tree in Mumbai, today it has risen to become one of the fastest stock exchanges in the world with a transaction speed of 6 microseconds.

    Key Features:

    • Historic credibility and regulatory robustness
    • Diverse investment options like equities, mutual funds, and SME platforms
    • State-of-the-art surveillance systems to detect market manipulation
    • Investor education and awareness initiatives

    Key Offerings:

    • Equities and equity derivatives
    • Debt securities
    • Mutual funds
    • SME platform (BSE SME)
    • Commodity derivatives (newly launched)

    SENSEX index representing 30 companies is measuring the mood of investors and 30 companies, representing India’s most-established blue-chip companies.

    Commodity Market: Trading Real-World Assets

    In commodity markets, the drama is all about the trading of raw or primary products, ranging from a commodity as cheap as grains and spices to metals and energy. 

    Commodities are thus filled with price volatility for producers, manufacturers, and investors as one way to exploit trading opportunities. In India, two leading commodities exchanges are as follows:

    Multi Commodity Exchange (MCX)

    MCX

    Website: mcxindia.com

    Founded: 2003

    Regulated by: SEBI

    MCX holds the largest share in commodity trading in India. Price discovery and liquidity are considered efficient in metal and energy contracts.

    Popular Commodities on MCX:

    Precious metals: Gold, Silver

    Base metals: Copper, Zinc, Lead, Nickel, Aluminium

    Energy: Crude Oil, Natural Gas

    MCX helps businesses and speculators manage risk from globally traded commodities.

    National Commodity and Derivatives Exchange (NCDEX)

    NCDEX

    Website: ncdex.com

    Founded: 2003

    Headquarters: Mumbai

    NCDEX specializes in agriculture-linked commodities and offers a transparent platform connecting farmers with processors, traders, and exporters.

    Traded Commodities:

    • Soybeans
    • Chana (Chickpeas)
    • Mustard Seed
    • Guar Gum
    • Castor Seed
    • Jeera (Cumin)

    NCDEX plays a key role in agricultural price risk management and – thus allows participants to lock in prices in advance through futures contracts.

    GIFT Nifty: Bridging Indian Markets with Global Investors

    GIFT Nifty

    GIFT Nifty – Traded via NSE International Exchange (NSE IX)

    GIFT Nifty is part of India’s broader plan to internationalize its financial services through GIFT City, Gujarat’s International Financial Services Centre (IFSC). It allows global investors to trade Indian index derivatives in USD.

    What Makes GIFT Nifty Different?

    FeatureNSE/BSEGIFT Nifty (NSE IX)
    CurrencyINRUSD
    Trading Hours9:15 AM – 3:30 PM ISTTwo sessions: 6:30 AM – 2:30 PM & 3:30 PM – 11:30 PM IST
    LocationIndiaGIFT City (Offshore IFSC)
    ParticipantsDomestic InvestorsGlobal Investors

    GIFT Nifty Products:

    • GIFT Nifty 50
    • GIFT Nifty Bank
    • GIFT Nifty Financial Services
    • GIFT Nifty IT

    Why It Matters:

    • Global Accessibility: Extended trading hours cover Asian, European, and U.S. time zones.
    • Dollar-Denominated: Attracts foreign investors who want exposure to Indian markets without INR exposure.
    • Regulatory Ease: Operates under IFSCA, offering relaxed tax and compliance structures.

    Metropolitan Stock Exchange of India (MSE)

    MCX

    It is one of the three stock exchanges recognized by Indian law, the other two being NSE and BSE. MSE was brought into being to increase competition and innovation in Indian financial markets and provides a trading platform for equity, equity derivatives, debt instruments, and currency derivatives.

    Overview

    Website: www.msei.in


    Incorporation: 2008

    Regulated by: Securities and Exchange Board of India (SEBI)

    Headquarters: Mumbai, India

    MSE has come into being to provide a modern and technology-driven trading environment to a wide market base and market participants. Even though it has relatively small trading volumes, MSE plays an integral part in bridging the financial markets, especially for those underserved populations such as Small and Medium Enterprises (SMEs) and regional investors.

    Key Offerings Equity Segment:

    Shares are traded concerning listed companies. MSE is promoting the listing of SMEs and startups so that an entrepreneurial growth environment flourishes.

    Equity Derivatives:

    Futures and options are based on both indices as well as individual stocks.

    Currency Derivatives: Contract in USD/INR, EUR/INR, GBP/INR, and JPY/INR.

    • Provides Forex Risk management tools to importers, exporters, and traders.
    • The Debt Segment Trading in Government Securities (G-Secs), Corporate Bonds, and T-Bills.
    • To create transparency and liquidity in India’s bond market.

    Their Specific Contributions

    Inclusivity: Targeting smaller brokers and regional participants under-served by larger exchanges.

    Technology Driven: Having a reliable and efficient architecture for trading.

    Support to SMEs: The exchange promotes SME listings, lending and funding opportunities available in India.

    Challenges & Opportunities


    While MSE has small trading volumes and market share compared to NSE and BSE, its role is, however, quite important in building an Indian capital market structure that would be more competitive, inclusive, and resilient. The regulatory support and reforms in the future could help MSE develop into a strong niche player over time.

    Cash Market Vs Commodity Market: A Quick Comparison

    FeatureCash MarketCommodity Market
    Assets TradedStocks, bonds, ETFsRaw materials: metals, agri, energy
    Ownership TransferImmediate (T+1)Contractual (Future settlement)
    ParticipantsRetail & institutional investorsHedgers (farmers, companies), traders
    Key ExchangesNSE, BSEMCX, NCDEX
    RegulationSEBISEBI

    Why These Exchanges Matter to You

    For Investors: Diversify your investment portfolios among stocks (NSE/BSE) and commodities (MCX/NCDEX) to better hedge risk and enhance returns. 

    For  Businesses: Protect raw material costs against price fluctuations in oil, grains, or metals. 

    For the Economy: Transparency in markets equals fair price, better capital allocation, and economic efficiency.

    Final Thoughts:

    India’s exchanges are not just marketplaces; they are engines of economic development and tools of financial empowerment. Whether impacting the risk of investing in blue chips via the NSE/BSE or hedging price risk of commodities via MCX/NCDEX: understanding these platforms will arm you with the information you need to make an informed decision. 

    With digital access, cheap brokerages, and an ever-rising financial literacy rate, this is the best era to get into trading opportunities that India has to offer.

    To Know More Details , Please Click Here

    Join Our Free Telegram Channel