
Thesafetrader

Author: thesafetrader.in

  • India’s IPO Rush: Top Listings in June 2025

    India’s IPO Rush: Top Listings in June 2025

    Top IPO Listings in June 2025

    An IPO (Initial Public Offering) is the process by which a private company offers its shares to the public for the first time and gets listed on a stock exchange. It allows companies to raise capital from investors while giving the public a chance to own a stake in the business.

    June 2025 has been a blockbuster month for India’s primary market. With a mix of large-cap and SME IPOs hitting the street, investor sentiment remains strong. From banking and real estate to engineering and healthcare, companies across sectors have chosen June as the best time to go public.

    Let’s take a closer look at the Top IPOs in June 2025, their details, and what investors should watch for.

    Highlights of June 2025 IPO Activity

    • 18+ companies launched IPOs this month.
    • Mix of Mainboard and SME IPOs.
    • Strong listings, especially in the SME segment.
    • HDB Financial Services is the biggest name this month.
    • Interest from both retail and institutional investors.

    Latest  IPOs in June 2025

    1. HDB Financial Services IPO

    • Type: Mainboard IPO
    • Issue Size: ₹12,500 crore
    • Price Band: ₹700–740
    • IPO Dates: June 25–27
    • About: A subsidiary of HDFC Bank, HDB is a leading NBFC focusing on retail loans and financial services.
    • Keyword: HDB Financial IPO 2025

    2. Kalpataru Projects International

    • Issue Size: ₹1,590 crore (fresh issue)
    • Price Band: ₹387–414
    • Dates: June 24–26
    • Sector: Real estate and construction (focus on MMR region)
    • Keyword: Kalpataru IPO June 2025

    3. Sambhav Steel Tubes

    • Size: ₹540 crore
    • Price Range: ₹77–82
    • Dates: June 25–27
    • Sector: Manufacturing (steel & infrastructure)
    • Keyword: Steel IPO India June 2025

    4. Indogulf Cropsciences

    • Issue Size: ₹200 crore
    • Price Band: ₹105–111
    • Dates: June 26–30
    • Sector: Agri-chemicals
    • Keyword: Indogulf Cropsciences IPO 2025

    Top SME IPOs to Watch

    India’s SME IPO segment continues to outperform in 2025. Here are some strong performers this month:

    1. Eppeltone Engineers Ltd

    • IPO Date: June 17–19
    • Price: ₹128/share
    • Listing Gain: 90% premium on debut (listed at ₹242)
    • Sector: Industrial automation & electricals
    • Keyword: Best SME IPO June 2025

    2. Safe Enterprises Retail Fixtures

    • Issue Size: ₹169.7 crore
    • Dates: June 20–24
    • Focus: Retail infrastructure solutions
    • Keyword: Safe Enterprises SME IPO 2025

    3. Aakaar Medical Technologies

    • Size: ₹27 crore
    • Dates: June 20–24
    • Sector: Healthcare & aesthetics
    • Keyword: Medical tech IPO India 2025

    4. AJC Jewel Limited

    • Issue Size: ₹14.6 crore
    • Dates: June 23–26
    • Industry: Jewellery and luxury retail
    • Keyword: Jewellery IPO June 2025

    Other notable SME IPOs include:

    • Icon Facilitators (June 24–26)
    • Globe Civil Projects (June 24–26)
    • Arisinfra, Samay Projects, and Mayasheel Retail

    Upcoming IPOs – What’s Ahead?

    PhonePe IPO – Coming Soon

    • Expected Size: ₹12,750 crore
    • Sector: Fintech
    • Note: Among the most anticipated IPOs in 2025.
    • Keyword: PhonePe IPO 2025

    SEBI Approvals

    • GNG Electronics, Amanta Healthcare, and Glottis Limited have recently received SEBI approval for IPOs.

    Investor Insights – Key Takeaways

    • GMP Trends: Grey Market Premiums are modest for big IPOs like Kalpataru (~₹5) but higher for some SMEs.
    • SME Boom: Smaller IPOs like Eppeltone show explosive listing gains—but come with higher risk.
    • Diversified Sectors: From NBFCs and real estate to tech and agri, investors can pick themes that suit their portfolios.
    • Retail Dominance: Retail investors are highly active in SME IPOs, while large institutions back Mainboard offerings.

    Tips for Investors

    •  Research Fundamentals before subscribing. Avoid chasing IPO hype.
    • Track GMPs, but don’t rely solely on them.
    • Diversify your IPO picks—don’t put all funds into a single company.
    • Use IPO allotment strategies like applying via UPI multiple accounts (if applicable).

    Final Thoughts

    June 2025 IPOs in India mark an exciting time for equity markets. Whether you’re an investor looking for stable long-term plays or short-term listing gains, there’s something for everyone. With marquee names like HDB Financial and a booming SME pipeline, IPO activity is expected to remain strong in the months ahead.

    Stay informed, invest wisely, and make the most of India’s IPO wave in 2025!

    Join Our Free Telegram Channel

  • Types of Investors in the Indian Stock Market

    Types of Investors in the Indian Stock Market

    Types Of Investors

    The Indian Stock Market is one of the largest and fastest-growing equity markets globally, driven by a mix of domestic and foreign investors. Each type of investor plays a distinct role in shaping market movements, liquidity, and sentiment. Let’s explore these types, their roles, and their impact — with real numbers and trends.

    Domestic Institutional Investors (DII)

    DIIs include mutual funds of India, insurance companies, pension funds, banks, and other big entities investing in domestic securities.

    • DIIs collectively owned about 16 to 18% of NSE-listed companies (as of 2024).
    • Mutual funds alone have AUM (Assets Under Management) of over ₹52 lakh crore

    Impact:

     In many cases, DIIs are the counterforce to FIIs. For example, when FIIs withdraw more than a lakh crore between 2022 and 2023 because of global uncertainty, DIIs gave support to the market with net inflows of nearly the same magnitude.

    Foreign Institutional Investors (FII)

    FIIs/FPIs are overseas funds investing in Indian equities, debt, and other securities.

    • FIIs own about 18–20% of the Indian equity market capitalization.
    • The year 2024 saw FIIs yield lucrative net inflows of above ₹1.4 lakh crore in the equity market-the result of renewed interest in India as a growth market.

    Impact:

    Generally, FIIs hold the status of suggestive influences of the market. Heavy inflows by them generate upward trends (take post-COVID), while their withdrawal creates volatility.

    High Net-Worth Individuals (HNI)

    HNIs are individuals with significant investable surplus, often above ₹2 crore, investing in stocks, bonds, PMS schemes, or AIFs.

    • The number of HNIs in India crossed 4.5 lakh individuals in 2023.
    • HNIs account for a significant chunk of direct stock market investment volumes, especially in mid-cap and small-cap spaces.

    Impact:
    HNIs often take concentrated bets or participate in block deals. Their moves are closely watched by brokers and analysts.

    Retail Investors


    These are individual investors who invest small amounts compared to institutions and HNIs. They participate through direct stocks, mutual funds, or ETFs.

    • For the record, more than 140 million demat accounts were active as of early 2024 — a sharp rise from about 40 million in 2019.
    • Direct holdings by these retail investors are around 7–8% of the total market capitalization. 

    Impact: 

    Retail investors dominate trading volume in small-cap and mid-cap stocks and are quickly becoming a force within IPO subscription.

    Hindu Undivided Family (HUF)

    The Indian legal system allows the traditional family investment structure, treated as a separate entity for tax and investment purposes. 

    HUFs have no separate public record for their holdings but form part of the retail/HNI investor set. They subconsciously get associated with long-term wealth-building opportunities like holding blue-chip stocks or mutual funds.

    Alternative Investment Funds (AIF)

    As the name indicates, they pool money from HNIs and institutional investors to invest in non-traditional assets such as private equity, venture capital, real estate, distressed debt, and hedge funds.

    •  AIFs have grown rapidly, with total AUM crossing ₹10 lakh crore in 2024.
    • Category II AIFs (private equity, real estate funds) constitute the largest share.

    Impact:

     AIFs take the Indian startup ecosystem, infrastructure, and other alternative sectors to more depth than what public markets offer.

    Mutual Funds (MF)

     Mutual funds pool savings from retail and HNI investors and invest in diversified portfolios of stocks, bonds, or hybrid assets.

    • MF industry AUM: ₹52–55 lakh crore as of mid-2024.
    • SIP contributions: Over ₹19,000 crore per month, showing rising retail participation.

    Impact:
    Mutual funds help channel domestic savings into the stock market and are key drivers of long-term stability and disciplined investing.

    Snapshot of Ownership (2024)

    Investor TypeMarket Share in NSE-Listed Cos (Approx.)
    FIIs / FPIs18% – 20%
    DIIs16% – 18%
    Mutual FundsPart of DIIs (AUM ₹52 lakh crore)
    Retail + HNI7% – 8%
    Government~6% (through direct holdings in PSUs)

    Conclusion

    The Indian stock market is a blend of domestic and global forces:

    • FIIs bring foreign capital but also volatility.
    • DIIs and MFs provide stability through steady investments.
    • Retail and HNIs represent growing confidence in equity as a wealth creator.
    • AIFs and HUFs add diversity and long-term depth.

    As an investor, understanding these players helps you interpret market moves better and design smarter strategies!

    Join Our Free Telegram Channel

  • Lot Size and Expiry Days in Index Options

    Lot Size and Expiry Days in Index Options

    Index Options

    Index Options have grown exponentially in popularity in India. With instruments like NIFTY, BANKNIFTY, and FINNIFTY, retail and institutional traders now have powerful tools to speculate, hedge, or diversify their exposure. This blog unpacks everything you need to know about Index Options, their lot sizes, and expiry schedules.

    What Are Index Options?

    An Index Option is a derivative contract that draws value from the underlying index like the NIFTY 50, BANK NIFTY, among others. They are European-style options, which means the exercise can only be done at expiry, and since they are cash-settled, there is no actual exercise of shares.

    There are two types of index options:

    • Call Options: The right to buy the index at a particular price. 
    • Put Options: The right to sell the index at a particular price.


    How Are Index Options Useful?

    Use CaseBenefit
    HedgingProtect portfolio against downside in market crashes.
    SpeculationTake directional bets on market trends with limited capital.
    Income GenerationUse strategies like covered calls or iron condors.
    Portfolio DiversificationReduce dependence on individual stocks by trading entire market segments.

    For example, if you expect the banking sector to outperform in the short term, trading BANKNIFTY options can offer leveraged exposure without needing to buy multiple banking stocks.

    Current Index Options Lot Sizes (Jun–Aug 2025)

    Lot size refers to the minimum number of units you need to trade in an options contract.

    IndexSymbolLot Size (Jun 2025)Lot Size (Jul 2025)Lot Size (Aug 2025)
    NIFTY 50NIFTY757575
    BANK NIFTYBANKNIFTY303535
    FINNIFTYFINNIFTY656565
    MIDCPNIFTYMIDCPNIFTY120140140
    NIFTY NEXT 50NIFTY NEXT 50252525

    Note: Lot sizes can be revised quarterly by the NSE based on the price movement and liquidity of each index.

    Expiry Schedule – Weekly & Monthly

    Expiry refers to the date on which the option contract ceases to exist. Each index has weekly and monthly expiries, providing frequent opportunities to trade.

    IndexWeekly ExpiryMonthly Expiry
    NIFTYThursdayLast Thursday of the month
    BANKNIFTYWednesdayLast Wednesday of the month
    FINNIFTYTuesdayLast Tuesday of the month
    MIDCPNIFTYMondayLast Monday of the month
    NIFTYNEXT50FridayLast Friday of the month
    SENSEX❌ (only monthly)Last Thursday of the month
    BANKEX❌ (only monthly)Last Thursday of the month

    🛑 If the expiry day is a trading holiday, it will be preponed to the previous trading day.

    Why Are Lot Sizes Important?

    • Margin Requirements: Smaller lot sizes mean smaller margin requirements; basically, good for the retail trader.
    • Scalability: Institutional traders can build large positions efficiently using multiple lots.
    • Volatility Management: Changing lot sizes affects liquidity and volatility. E.g., a jump in MIDCPNIFTY lot size from 120 to 140 may affect spread and order book depth.

    Key Features of Popular Index Options

    NIFTY 50

    • India’s benchmark index.
    • Broad market exposure.
    • Most liquid options contract.

    BANKNIFTY

    • Representing 12 major banking stocks.
    • Higher volatility, so higher returns (and risks).
    • Best intraday traders.

    FINNIFTY

    • Represents 20 financial services stocks.
    • A sector-specific exposure.
    • Good for weekly income generation strategies.

    MIDCAPNIFTY

    • Comprises 50 midcap stocks.
    • Great for positional traders.
    • Higher interest by options writers.

    NIFTY NEXT 50

    • Consists of stocks ranked 51–100 on NSE.
    • Works as a feeder index for the NIFTY 50.
    • Lower lot sizes mean retail interest.

    BSE Derivatives: SENSEX & BANKEX

    IndexWeekly ExpiryMonthly ExpiryLot Size
    SENSEXLast Thursday15
    BANKEXLast Thursday20

    BSE offers derivative contracts on SENSEX and BANKEX, but trading volumes are comparatively lower than NSE. These instruments are generally used by arbitrageurs or long-term hedgers.

    Risk Factors to Consider

    • Time Decay (Theta): As the expiry date closes in, options lose their value.
    • Volatility Risk: Whenever a sudden news arises in the market, an instant spike in implied volatility occurs.
    • Liquidity Gaps: Some of the index options may not be very liquid. 
    • Margin Requirements: Make sure that you are aware of the span + exposure margins before placing your trades.

    Trading Tips

    1. Use Weekly Options for short-term directional trades.
    2. Monthly options suit swing and positional trades better.
    3. Stick to liquid contracts (NIFTY, BANKNIFTY) for less slippage.
    4. Be aware of the changes in lot size every quarter.

    Final Thoughts

    Index Options are powerful instruments in the hands of learned traders and investors. By understanding lot sizes, expiry days, and the characteristic features of each index, you will be in a position to frame a strategy that serves your financial goals.

    Whether you are:

    • Writing options for income, 
    • Buying options for momentum plays, 
    • or hedging long-term equity exposure… 

    👉 Index options can bring flexibility and depth to your trading portfolio.

    Join Our Free Telegram Channel


  • What Is Support and Resistance in Trading?

    What Is Support and Resistance in Trading?

    Understanding Support and Resistance is one of the foundational concepts in any Trading Strategy. Support-resistance identification is among the primary tools used by traders and investors to identify high-probability opportunities. When you know how to identify these levels, you can make better decisions while managing your risks. Being able to work with support and resistance will definitely improve your trading results.

    Understanding Support & Resistance: The Basics Every Trader Must Know

    What Are Support & Resistance?

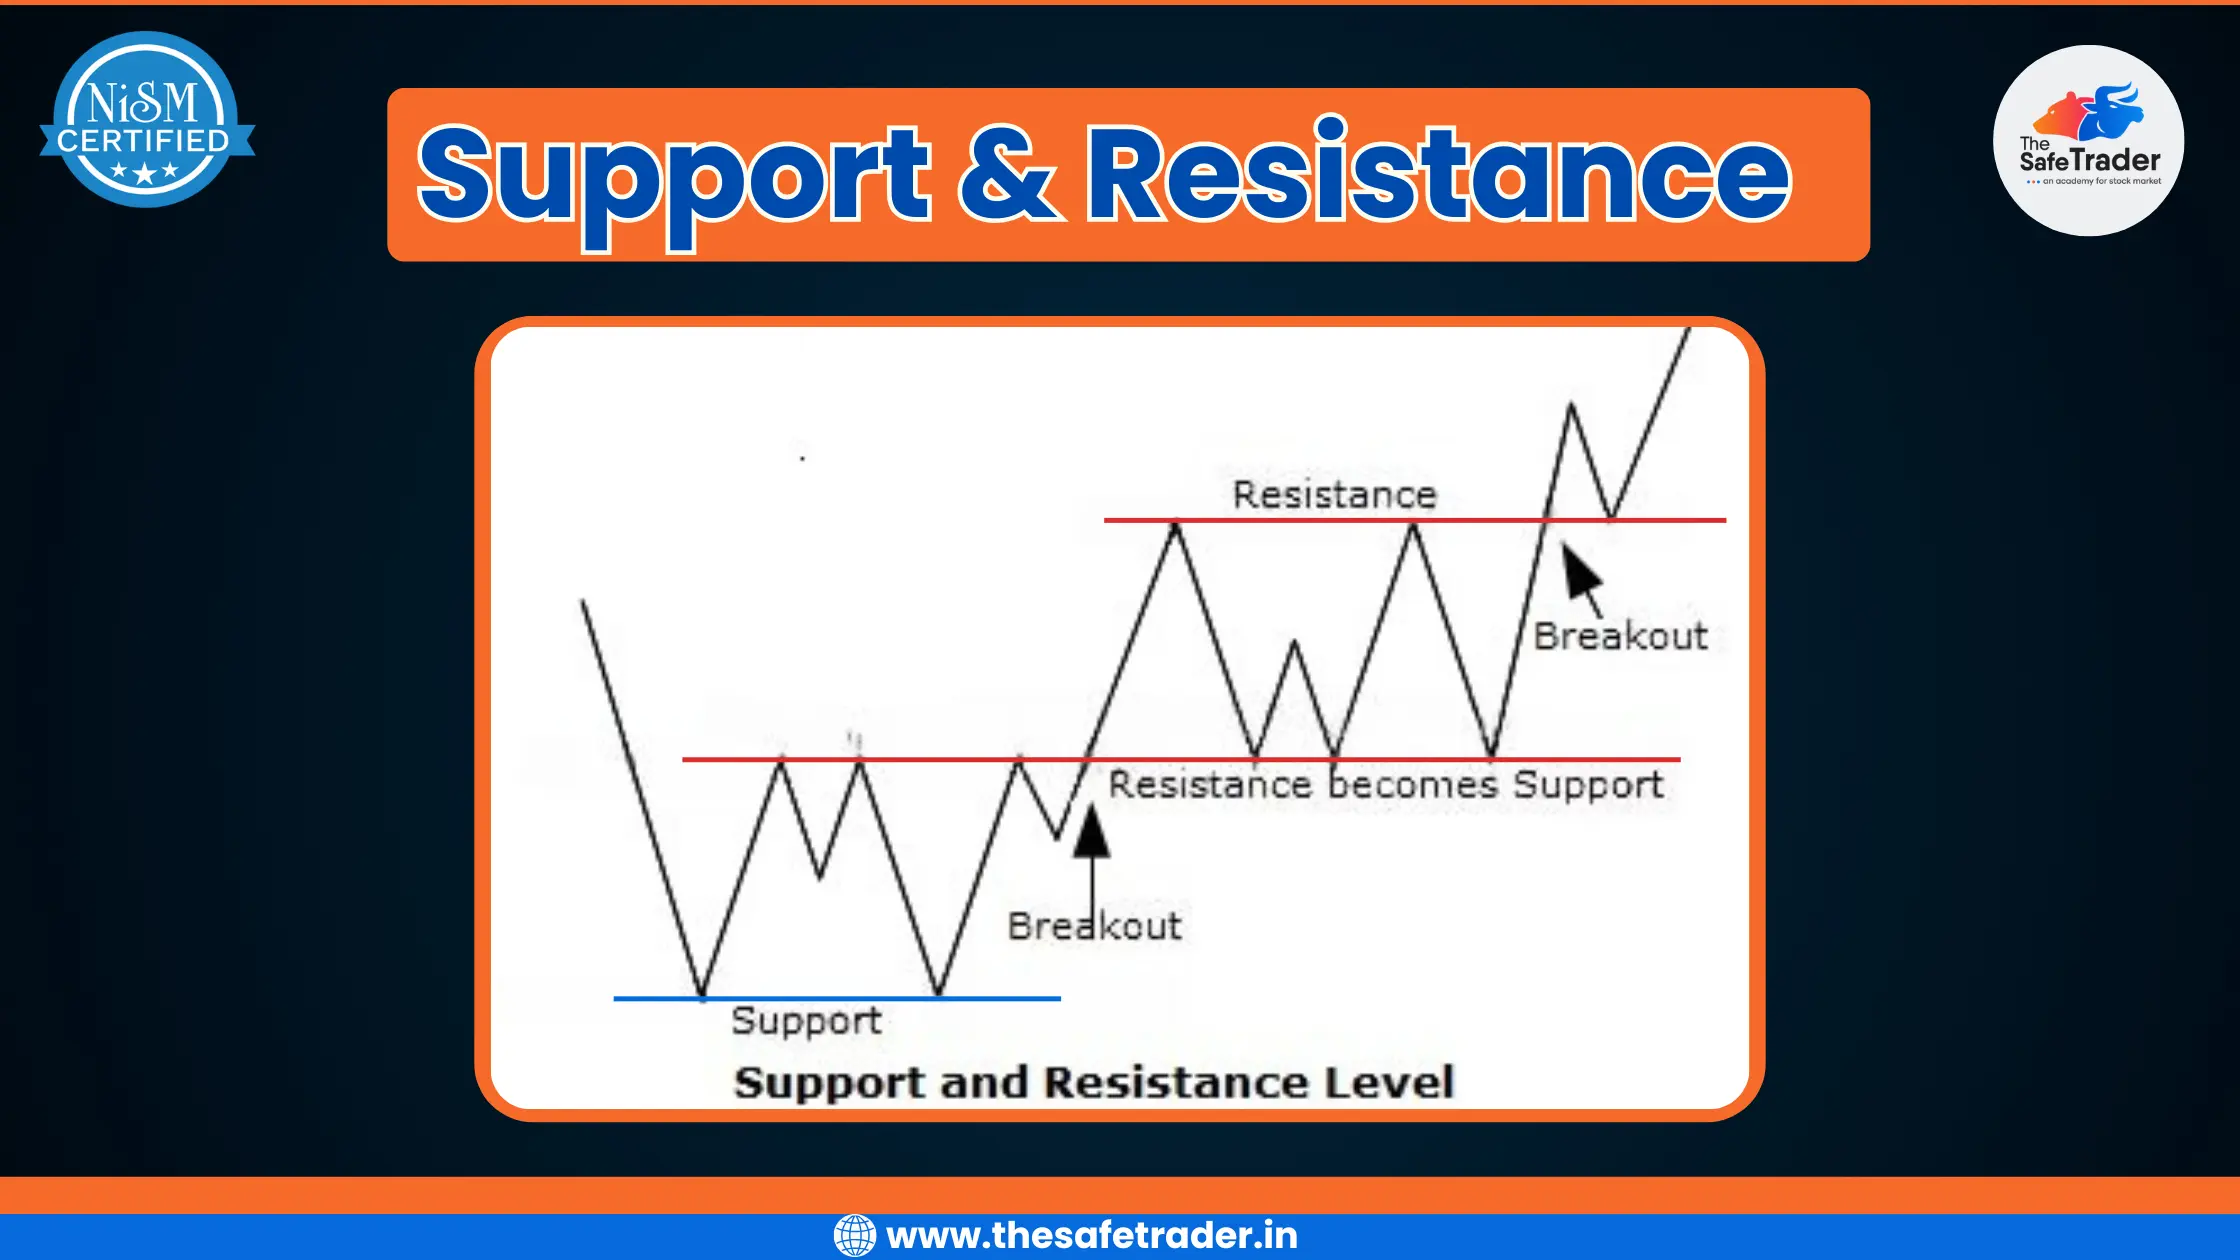
    Support is a price level where buyers tend to jump in, preventing the price from dropping further. Think of support as a floor that keeps prices from falling below. Resistance is the opposite; it’s a price level where sellers emerge, stopping prices from climbing higher. It acts like a ceiling that holds prices back.

    Naturally, these levels come into existence by the actions of a lot of people, applying their interpretations of what they see in the market. Supply-demand situations and psychology are two driving forces behind it. When an enormous number of traders believe that a certain level will hold, it does create a self-fulfilling prophecy.

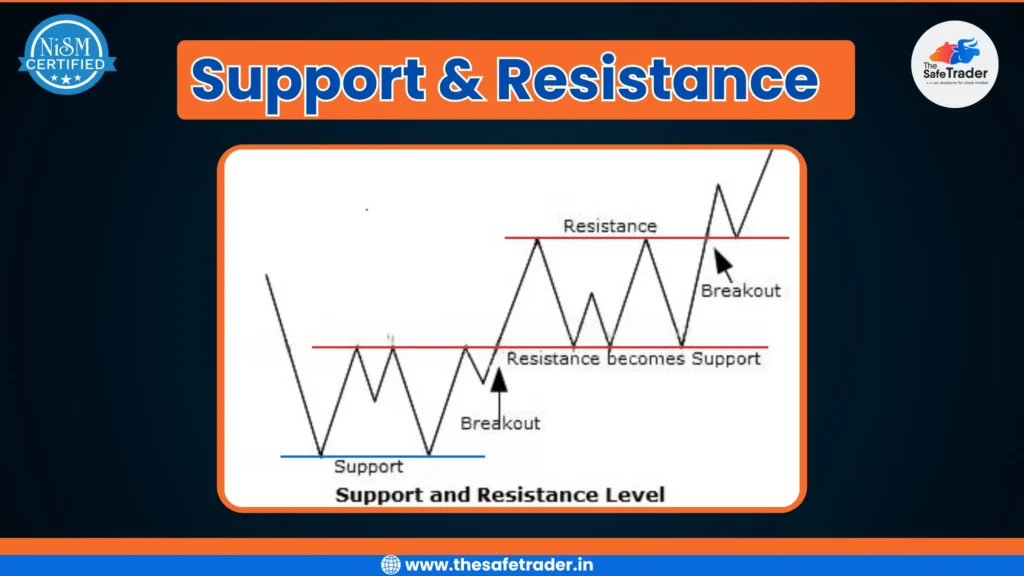
    Support and Resistance Chart

    The Significance of Support and Resistance in Trading

    Support and resistance levels act as mental barriers for traders. They shape how traders view possible market turns. Most successful traders keep an eye on these levels to catch reversals or breakouts before they happen. Statistically, about 80% of market reversals happen near these key levels. Experts agree that support and resistance are vital for planning trades.

    How Support & Resistance Levels Are Identified

    Chart Based Techniques

    The easiest way of finding support and resistance is by going through price charts and analyzing them. Look for regions where the price touches the level multiple times but fails to break through them. These levels are usually marked by horizontal lines, trendlines, or round numbers. With time, it makes zones that traders closely monitor.

    Technical Indicators and Tools

    To further confirm support/resistance levels, various tools could be used, including moving averages, Fibonacci retracements, and pivot points. Moving averages give the average prices for a given time and usually act as dynamic possible support or resistance. Fibonacci Levels give some ratios considered important and tell where the price may bounce. Pivot Points are calculated using prices of earlier days and give possible turning points.

    Confirming Support & Resistance

    Don’t just rely on a visual analysis. Wait for confirmation of support and resistance in the form of specific candlestick patterns like hammer or engulfing candles, a volume spike, or an unexpected price gap. Such hints will help you identify false breakouts when price only dips or jumps temporarily.

    Practical Applications of Support & Resistance for Traders and Investors

    Entry and Exit Strategies

    Support and resistance help determine when may be good times to buy or sell. A bounce off support may provide a great buy point. When the price is hitting resistance, it may be a good time to sell. A breakout happens when the price pushes beyond a level, with traders watching these events to rake in quick profits.

    Stop-Loss and Take-Profit Orders

    Smart traders will place stop-loss orders just below support or above resistance, limiting their losses. E.g., suppose you bought at support; then, setting a stop-loss just below that level ensures you don’t get wiped out from a sharp fall. Targets for profit should be near the next support or resistance, allowing you to get away with your gain easily.

    Managing Risk and Improving Trade Probability

    Support and resistance levels assist you in weighing risk versus reward. A trade that is stopped close to support and giving higher chances of gain near resistance has higher chances of winning. Think of these levels as nets to help you catch smarter trades.

    How It Helps Investors

    While traders focus on short-term movements, investors use support and resistance to:

    1. Buy During Dips (Value Investing):
      • Buying near strong support levels allows investors to enter at relatively lower prices.
    2. Avoid Buying at Overvalued Levels:
      • Resistance zones help investors avoid buying at peaks where the price might reverse.
    3. Long-Term Trend Confirmation:
      • If a stock repeatedly holds above long-term support or breaks major resistance, it shows strength and growth potential.

    Limitations and Common Challenges

    False Breakouts and Whipsaws

    The price, at times, appears to break the support or resistance and then suddenly reverses. Such false signals bait traders into wrong trades. To avoid such mistakes, one must wait for confirmation such as volume spike or candle patterns. 

    Dynamic Nature of Support & Resistance

    The levels are not set in stone; they evolve with the market. A support zone may become resistance in a week’s time. Therefore, stay alert and refresh your levels on an hourly basis. 

    Combining Support & Resistance with Other Indicators

    Other indicators like oscillators or trend indicators help to increase accuracy. For example, volume analysis aids in confirming a legitimate breakout. By combining multiple signals, one can get a clearer picture and save themselves from bad trades.

    Advanced Concepts and Tips for Effective Use

    Trading Strategies Focused on Support & Resistance

    There are various methods for trading around support and resistance. Breakout trading intends to exploit strong price actions beyond these levels. Bounce trades are conducted by buying at support levels or selling at resistance levels. Range trades are executed between support and resistance to buy low and sell high within the channel.

    Using Multiple Timeframes

    Looking for support and resistance at different time frames just strengthens your analysis. Support on a daily chart might be more reliable than support on a 5-minute chart. Hence, long-term levels do hold more weight, with short-term levels signaling quick trade.

    How It Helps in Strategy Building

    ✅ For Traders:

    • Enhances decision-making for entry & exit
    • Improves risk management by placing stop-loss orders just below support or above resistance
    • Useful in forming breakout and reversal strategies

    ✅ For Investors:

    • Identifies favorable buying zones
    • Helps avoid buying in overbought regions near resistance
    • Enables strategic profit-booking

    Conclusion

    Support and Resistance are two fundamental pillars in Technical Analysis. They help you identify high-probability trade setups and manage risk. Spotting these levels accurately allows you to plan better entries, exits, and stop-loss placements. Remember, support and resistance are not perfect—they shift and evolve over time. Continuous learning, disciplined trading, and combining them with other tools make these levels powerful for consistent success. Keep practicing, stay alert, and let support and resistance guide your way to smarter trading.

  • Time Frame Guide for Traders

    Time Frame Guide for Traders

    Time Frame Guide

    In the world of Stock Market Trading, the varieties of time frames and charting intervals are of utmost importance; they basically serve as the cornerstones of your trading strategy. From those that engage in long-term investing to those who engage in scalping by minutes, all of these traders should be fully aware of how time frames sync up with their goals, psychology, and available time.

    In this blog, we analyze the Time Frame Guide by The Safe Trader, a NISM-certified mentor that empowers traders in India. Let’s now proceed to understanding the details of various trading styles and how to relate them to your suitable time horizon.

    What is a Time Frame in Trading?

    A Time Frame is the length of time in which a price chart undergoes analysis in technical or trading decisions. In other words, whether you are observing the price movement shown by a candlestick every 15 minutes or the price movement on a daily or weekly chart, your time frame encompasses:

    • The frequency of trades
    • Duration of holding
    • Risk and reward expectations
    • Strategy and indicators used

    Each style of trading coincides with a particular time frame and outlook- ranging from long-term investing to ultra-short-term scalping.

    Time Frame Guide for Traders: Styles, Periods & Time Frames

    1. Position Trading (Long-Term)

    • Period: Long Term
    • Time Frame: Daily
    • Best For: Long-term investors and professionals who prefer minimal intervention.
    • Strategy: Uses fundamental analysis (earnings, valuation, news).
    • Example: Buying a fundamentally strong stock like Infosys or HDFC Bank and holding it for 6 months to 2 years.

    Pros:

    • Low stress and fewer trades
    • Takes advantage of major trends
    • Ideal for people with jobs or other businesses

    Cons:

    • Requires patience
    • Misses short-term opportunities

    2. Swing Trading (Medium-Term)

    • Period: Medium Term
    • Time Frame: 4 Hour
    • Best For: Part-time traders who want to profit from medium-term trends.
    • Strategy: Combines technical analysis and market momentum.
    • Example: Buying a breakout stock during a sector rally and holding it for a few days or weeks.

    Pros:

    • Balances risk and reward
    • Less screen time than day trading
    • Effective for trending markets

    Cons:

    • Requires weekend planning
    • Sensitive to overnight gaps

    3. Day Trading (Short-Term)

    • Period: Short Term
    • Time Frame: Hourly
    • Best For: Full-time traders with access to real-time charts and quick execution.
    • Strategy: Focuses on intraday price movements, volatility, and volume patterns.
    • Example: Taking trades on Bank Nifty during high volume periods like market open or close.

    Pros:

    • No overnight risk
    • Daily income potential
    • Fast feedback on strategy

    Cons:

    • Emotionally intense
    • Requires constant focus

    4. Scalping (Ultra Short-Term)

    • Period: Short Term
    • Time Frame: 15 Min
    • Best For: Expert traders who thrive in high-speed environments.
    • Strategy: Capitalizes on tiny price changes. Trades last from seconds to minutes.
    • Example: Scalping 5–10 points on Nifty Futures multiple times during market hours.

    Benefits:

    • Fast gains with multiple trades
    • Exploits short-term inefficiencies
    • Great for volatile instruments

    Drawbacks:

    • Requires lightning-fast decisions
    • Can be stressful and mentally exhausting

    Learn From the Best – The Safe Trader Academy

    Their courses cover:

    • Technical & fundamental analysis
    • Risk management
    • Strategy building for different time frames
    • Live market practice sessions

    The modules aim to prepare students for a safer trade experience, whether they be college students, working professionals, or budding traders.

    Bonus Strategy: Multi-Time Frame Analysis (MTFA)

    Professional traders often combine multiple time frames to improve their accuracy and timing.

    How it works:

    • Higher Time Frame (HTF): Identifies overall trend (e.g., daily)
    • Mid Time Frame (MTF): Confirms setup (e.g., 4-hour)
    • Lower Time Frame (LTF): Triggers entry/exit (e.g., 15-min)

    Example:
    A swing trader checks:

    • Daily chart: Trend is bullish
    • 4-Hour chart: Price breaks resistance
    • 15-Minute chart: Entry confirmed with volume spike

    MTFA = Bigger picture + Better timing.

    Psychology & Time Frames: Trading Time Frame Analysis

    Each trading style demands a different mindset:

    StyleRequiresSuits
    Position TradingPatience, trust in fundamentalsLong-term thinkers
    Swing TradingTactical execution, patiencePart-time traders
    Day TradingFocus, speed, strategyFull-time professionals
    ScalpingUltra-discipline, low latencyAdvanced traders

    Note: Don’t copy others blindly. Know your emotional strength, risk tolerance, and time commitment before choosing a Trade.

    Common Mistakes to Avoid

    1. Switching Time Frames Frequently –  Leads to confusion and poor decision-making
    2. Using the Same Indicators Over All Time Frames: Different time frames require different settings (e.g., RSI 14 on daily ≠ RSI 14 on 15-min). 
    3. Ignoring Risk-Reward Ratio: It burns you in short-term trading even more.
    4. Overtrading in Scalping or Day Trading: More trades do not necessarily mean more profits.
    5. Not Using Stop-Losses: Time frames don’t protect you from poor discipline

    Tools & Indicators Used by Best Time Frame in Stock Market

    Different time frames demand different tools and techniques. Here’s a breakdown of what traders commonly use at each level:

    Time FrameCommon IndicatorsTools
    DailyMoving Averages, RSI, MACD, TrendlinesFundamental reports, Daily charts
    4 HourBollinger Bands, Fibonacci Retracements, RSITradingView, Price Action, Swing Setups
    HourlyVWAP, Support/Resistance, Breakout ZonesIntraday charts, Sector strength analysis
    15 MinEMA (9/21), Volume, Momentum OscillatorsFast-execution brokers, Level 2 data, Scalping bots

    The Safe Trader Advantages:

    What sets The Safe Trader apart?

    NISM-Certified Trainers
    Live Trading Sessions
    Customized Courses by Style
    Practical Learning + Psychological Coaching
    Supportive Community of Like-Minded Traders

    Whether you’re starting out or aiming to go pro, their step-by-step training on Time Frame Strategies ensures you’re always trading with purpose.

    Time Frame for Technical Analysis: Match Your Time Frame to Your Goals

    Your ProfileBest Time Frame
    Working ProfessionalDaily / 4 Hour (Swing/Position)
    College StudentHourly / Daily (Day/Swing)
    Full-Time Trader15 Min / Hourly (Day/Scalping)
    InvestorDaily / Weekly (Position)

    Choose one time frame, build mastery, then explore others.

    Final Thoughts: Time Frame in Stock Market

    The difference between a struggling trader and a consistent one often comes down to clarity of time frame. It’s your lens, your battlefield, your compass.

    🔑 Understand it.
    🔒 Stick to it.
    📈 Master it.

    If you’re serious about building a strategy-based trading journey, The Safe Trader Academy has your back — in the classroom, in the markets, and in your mindset.

    Join Our Free Telegram Channel

  • 8 Trading Tips That Can Transform Your Journey

    8 Trading Tips That Can Transform Your Journey

    Trading Tips That Can Transform Your Journey

    Think of the stock market like a battlefield of emotion, self-discipline, and strategizing. Every trader walks in there hoping to find financial freedom, and only a few manage to do so in a consistent manner. Why? Because successful trading is not about being able to foresee the market; it is about managing your own conduct.

    At The Safe Trader Academy, we believe in empowering traders beyond tools and charts, providing them also with the mindset and discipline needed for success. Thus we gathered these eight essential points of advice-anyone serious about learning to trade must have them on hand to be fully reminded of them each and every day.

    The Safe Trader

    Let’s take a look at these points and discuss how they apply to real-world trading:

    1. Patience, Patience, Patience.

    If you ask any successful trader about his most important asset, he would say patience instead of fancy indicators.

    Waiting for the right setup can feel boring when the markets are moving fast. But trading is a game of precision, not speed. Impulsive entries are a sure way to burn your capital. With the benefit of being patient, you can ensure that you get in at good levels and always exit wisely. It puts you above FOMO (fear of missing out) and gives you the slight advantage that most traders lack.

    Tip: If you feel the urge to enter a trade without a solid reason, step back. Boredom should never lead to a trade.

    2. Don’t Overtrade

    More trades ≠ more profits.

    Usually, overtrading occurs because of boredom, revenge, or overconfidence. Every trade should have a setup, a risk-reward ratio, and a reason for entering a trade. Think quality versus quantity. 

    Analogy: A sniper takes one shot after hours of waiting; a machine gun sprays and prays. Be a sniper. 

    3. Only Take High-Quality Trades 

    Every trade carries risk. Why risk your capital on a set-up that has a low probability of success? 

    A high-quality trade is one that fits your strategy, market structure, time frame, and risk parameters. In other words, it is not just a trade to make money but to make smart trading decisions. 

    Before you enter a trade, ask yourself the following questions:

    • Does this fit my strategy?
    • What is the risk-to-reward ratio?
    • Am I emotionally neutral right now?

    4. Trade With Logic, Not Emotions

    Most losses don’t come from the market—they come from ourselves.

    Emotional states such as fear, greed, anger, or euphoria have the power to cloud one’s judgment. A trader must develop an unemotional approach to decision-making if he wants to succeed: trade with data, logic, and discipline.

    Don’t:

    • Double the lot size after a loss. 
    • Exit trade early out of fear. 

    Do:

    • Stick to your plan against all odds! 

    5. Don’t “Revenge Trade” After a Losing Streak

    Everyone loses. Even the best traders.

    How they handle it distinguishes them. Revenge trading — trying to win money back quickly — leads to bigger losses. It is emotional, irrational, and destructive. 

    Rule: After 2 or 3 losses in a row, stop, review your trades and regain emotional control.

    6. Don’t Become Overconfident After a Winning Streak

    Confidence is good. Overconfidence is dangerous.

    After a few wins, many traders go ahead and increase their lot sizes or worse, take some riskier entries and may even start ignoring their system for obvious reasons. That would be in the market coming down on them. Keep your feet on the ground. Be humble.

    Reminder: A recent profit does not offer any guarantee about future profits.

    7. Less Indicators, More Price Action

    You and I don’t need 10 indicators to analyze a chart. Too many indicators, actually, cause confusion and paralysis.

    Learn to read price action: candlesticks, support/resistance, trendlines, and volume. These are the languages of the market.

    Suggestion: Keep to 1 or 2 indicators that complement your price action thesis. Keep your charts clean.

    8. Learn Something New Everyday

    The best traders are lifelong students.

    Markets change. New patterns emerge. Technology develops. Thus, learning should be set as a daily chore; read, watch, review, and reflect.

    Learning Ideas:

    • Study past trades.
    • Read books on trading psychology.
    • Follow quality educational content.
    • Join trading communities for discussion.

    Why Follow These Tips?

    Following these 8 trading principles can help you:

    • Protect your capital
    • Reduce psychological stress
    • Avoid beginner traps
    • Build long-term consistency

    Whether you’re day trading, swing trading, or investing, these tips will help you operate with clarity and confidence.

    Final Words: Trading is a Journey, Not a Sprint

    These tips are your daily compass, guiding you through the ups and downs of trading. Whether you’re just starting or have years of experience, these principles will help you build a strong, consistent, and professional trading routine.

    The Safe Trader Academy, with certified trainers and real-market exposure, is committed to helping you become a safe and confident trader.

    Office Picture
    Join Our Free Telegram channel
  • Happiest Minds Breakout: The Calm Before a Big Rally?

    Happiest Minds Breakout: The Calm Before a Big Rally?

    Happiest Minds

    Introduction: 

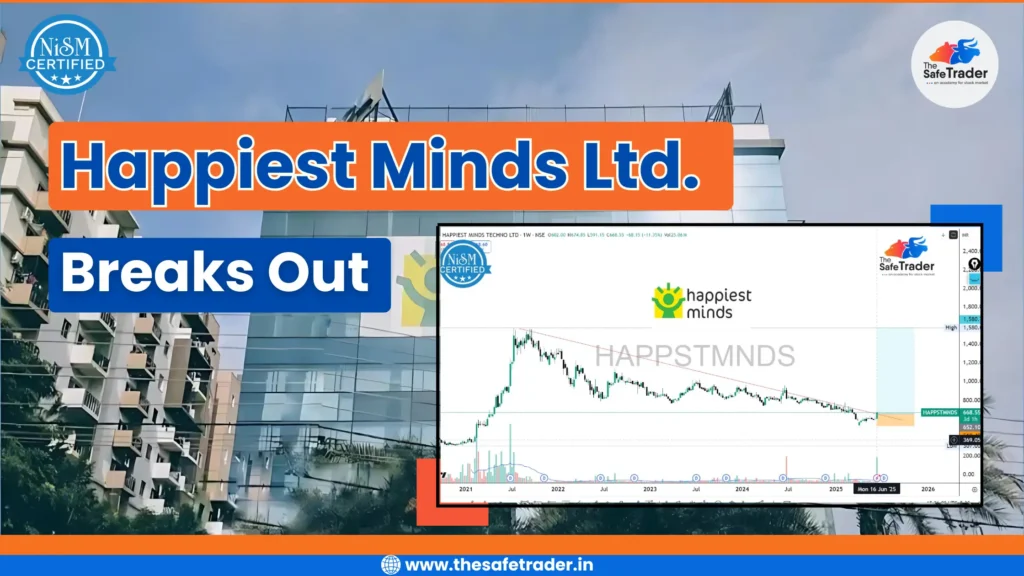
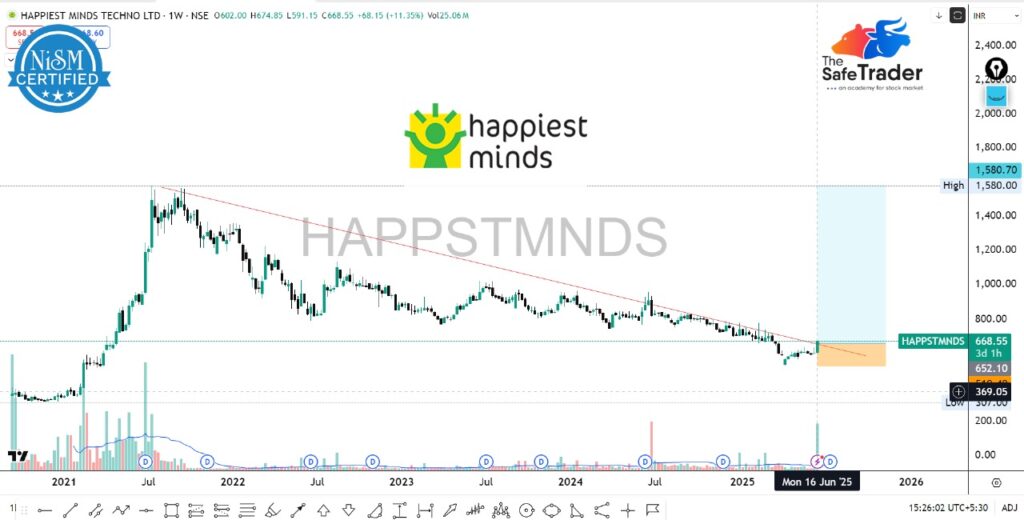
    Happiest Minds Technologies Ltd. (NSE: HAPPSTMNDS), a well-known mid-cap IT player, has been under the radar for the past couple of years due to its steep correction from all-time highs. But this week, a sudden 11.35% surge has turned all eyes back to this counter. Is this a technical breakout, or just another short-lived bounce?

    Let’s decode the price structure, volume action, and future prospects of this trending stock.

    A Silent Comeback in the Making?

    In a frequently hype-driven and herd-oriented market, opportunities do present themselves in stealth — including the Happiest Minds Technologies Ltd. (NSE: HAPPSTMNDS) share. 

    After being battered by a prolonged downtrend lasting over three years, the stock has finally shown signs of life. The latest weekly candle tells a story of resurgence — a breakout backed by strong volume and a double-digit price move. Could this be the turning point? Let’s dive deeper.

    Historical Overview:

    Since Happiest Minds had gone public and made its debut on the primary stock market in 2020, it drew the investor’s eyes primarily for its digital-first IT service offering. Exploiting the tech boom, the price of this stock grew very quickly to around ₹1,580 by mid-2021. From hereon began a bearish trend for years, precipitated by: 

    • Overstretched valuations
    • General IT sector correction
    • Declining earnings momentum
    • Global tech slowdown

    From its peaks at ₹1,580, the stock saw a plunge of over 75% to hit a lifetime low of ₹369 by early 2025 — really getting even the long-term investor-testing patience and conviction.

    The Fall from Grace: A Quick Recap

    For a time, Happiest Minds was a darling of the tech investors after the IPO boom. The new-age technology company was riding the wave of digital transformation to euphoric highs of ₹1,580 in 2021. But, as macro pressures, valuation concerns, and cheapest sector rotation started setting in, the stock fizzled out — losing over 75% of its value, hitting near its bottom at ₹369.

    This long and agonizing correction saw:

    • Investors exiting due to fear and underperformance
    • Valuations dropping to more reasonable levels
    • Volume and sentiment declining across the board
    Happiest Minds Chart

    Technical Chart Analysis

    The weekly chart is telling a totally different story — a reversal could be in play.

    Key Observations:

    1. Downtrend Breakout:

     Clean breakout above the long-term descending trendline, which is in existence since sometime mid-2021. This is the first weekly close above this trendline for nearly 3 years.

    1. Volume Confirmation:

     Volume at the week stands at 25 million, much above the average, signifying strong institutional activity.

    1. Demand Zone Reversal:

     The bounce happened from a major demand zone (₹600–₹650), showing interest of buyers at historical supports.

    1. Momentum Shift:

     RSI probably indicates a bullish turn-up with a move above 50, while MACD may soon look for a crossover if the momentum sustains.

    📌 Breakout Zone: ₹660–₹675
    📌 Target Zone (Short-Term): ₹800–₹850
    📌 Major Resistance: ₹950 & ₹1,150
    📌 Stop-Loss for Traders: ₹620 (below trendline & base)

    Fundamental Perspective: Is the Business Still Strong?

    Despite the price erosion, Happiest Minds continues to be a profitable, cash-generating mid-cap IT player focused on digital services, AI, cloud, and product engineering.

    Fundamental Snapshot (FY24–25)

    While technicals are in focus, let’s not ignore the fundamentals:

    MetricValue
    Market Cap₹9,700 Crores approx.
    PE Ratio42x (post-correction)
    Revenue Growth (YoY)~17%
    Net Profit Margin20–21% Range
    Debt-Free Status✅ Yes

    Despite the correction in price, the company remains fundamentally sound, with consistent growth in revenue and margins. It remains debt-free — a big positive in a rising interest rate environment.

    Market Sentiment: What Are Traders & Institutions Seeing?

    Positive Signals:

    • Long-term investors are seemingly entering support zones again.
    • Social media buzz and discussions in stock communities watching the breakout.
    • Options data show a parade of bullish bets.

    Caution Flags:

    • Between ₹800 and ₹950 lies a resistance zone that will see selling pressure.
    • The IT sector is also facing some macro headwinds in the US & Europe.
    • One breakout candle never confirms trend reversal without a follow-through.

    Verdict: A watch on the next 2 or 3 candles on a weekly chart might confirm whether momentum is sustainable.

    Outlook: Can Happiest Minds Reach ₹1,000+ Again?

    If technically the ₹800–₹850 barriers are swept away with conviction, the stock might go on to:

    • Fill the previous gap zones of 2022
    • Regain interest from institutional investors
    • Go into multi-leg uptrend for 12–18 months

    Fundamentally, a revival of demand for digital transformation and AI-driven services could become the next catalyst.

    Bottom Line: If this indeed turns out to be a breakout with strong conviction, then Happiest Minds could be a journey towards four digits — but just onto market patience and proper risk management.

    Conclusion

    Happiest Minds Technologies seems to be at a conclusive turning point. The breakout witnessed recently, in conjunction with sound price action and volume, is an event that can never be ignored on the four-year-long downtrend. For the traders, it is the classic textbook breakout; for the investors, this could signal the beginning of a value-led recovery in the downtrodden but fundamentally promising IT stock.

    Always remember, success is built on discipline — enter smartly, manage risk, and protect your profits. Be it momentum trading or just believing long term in India’s digital growth story, Happiest Minds must feature on your portfolio radar for keen observation.

    Join Our Free Telegram Channel

  • Kalyani Steels Breaks Out: Start of a New Bullish Trend?

    Kalyani Steels Breaks Out: Start of a New Bullish Trend?

    Kalyani Steels Breaks Out

    In a market where large-cap momentum has been grabbing headlines, mid-cap and small-cap stocks are quietly preparing for their next big move. One such stock making noise with its recent breakout is Kalyani Steels Ltd (KSL)

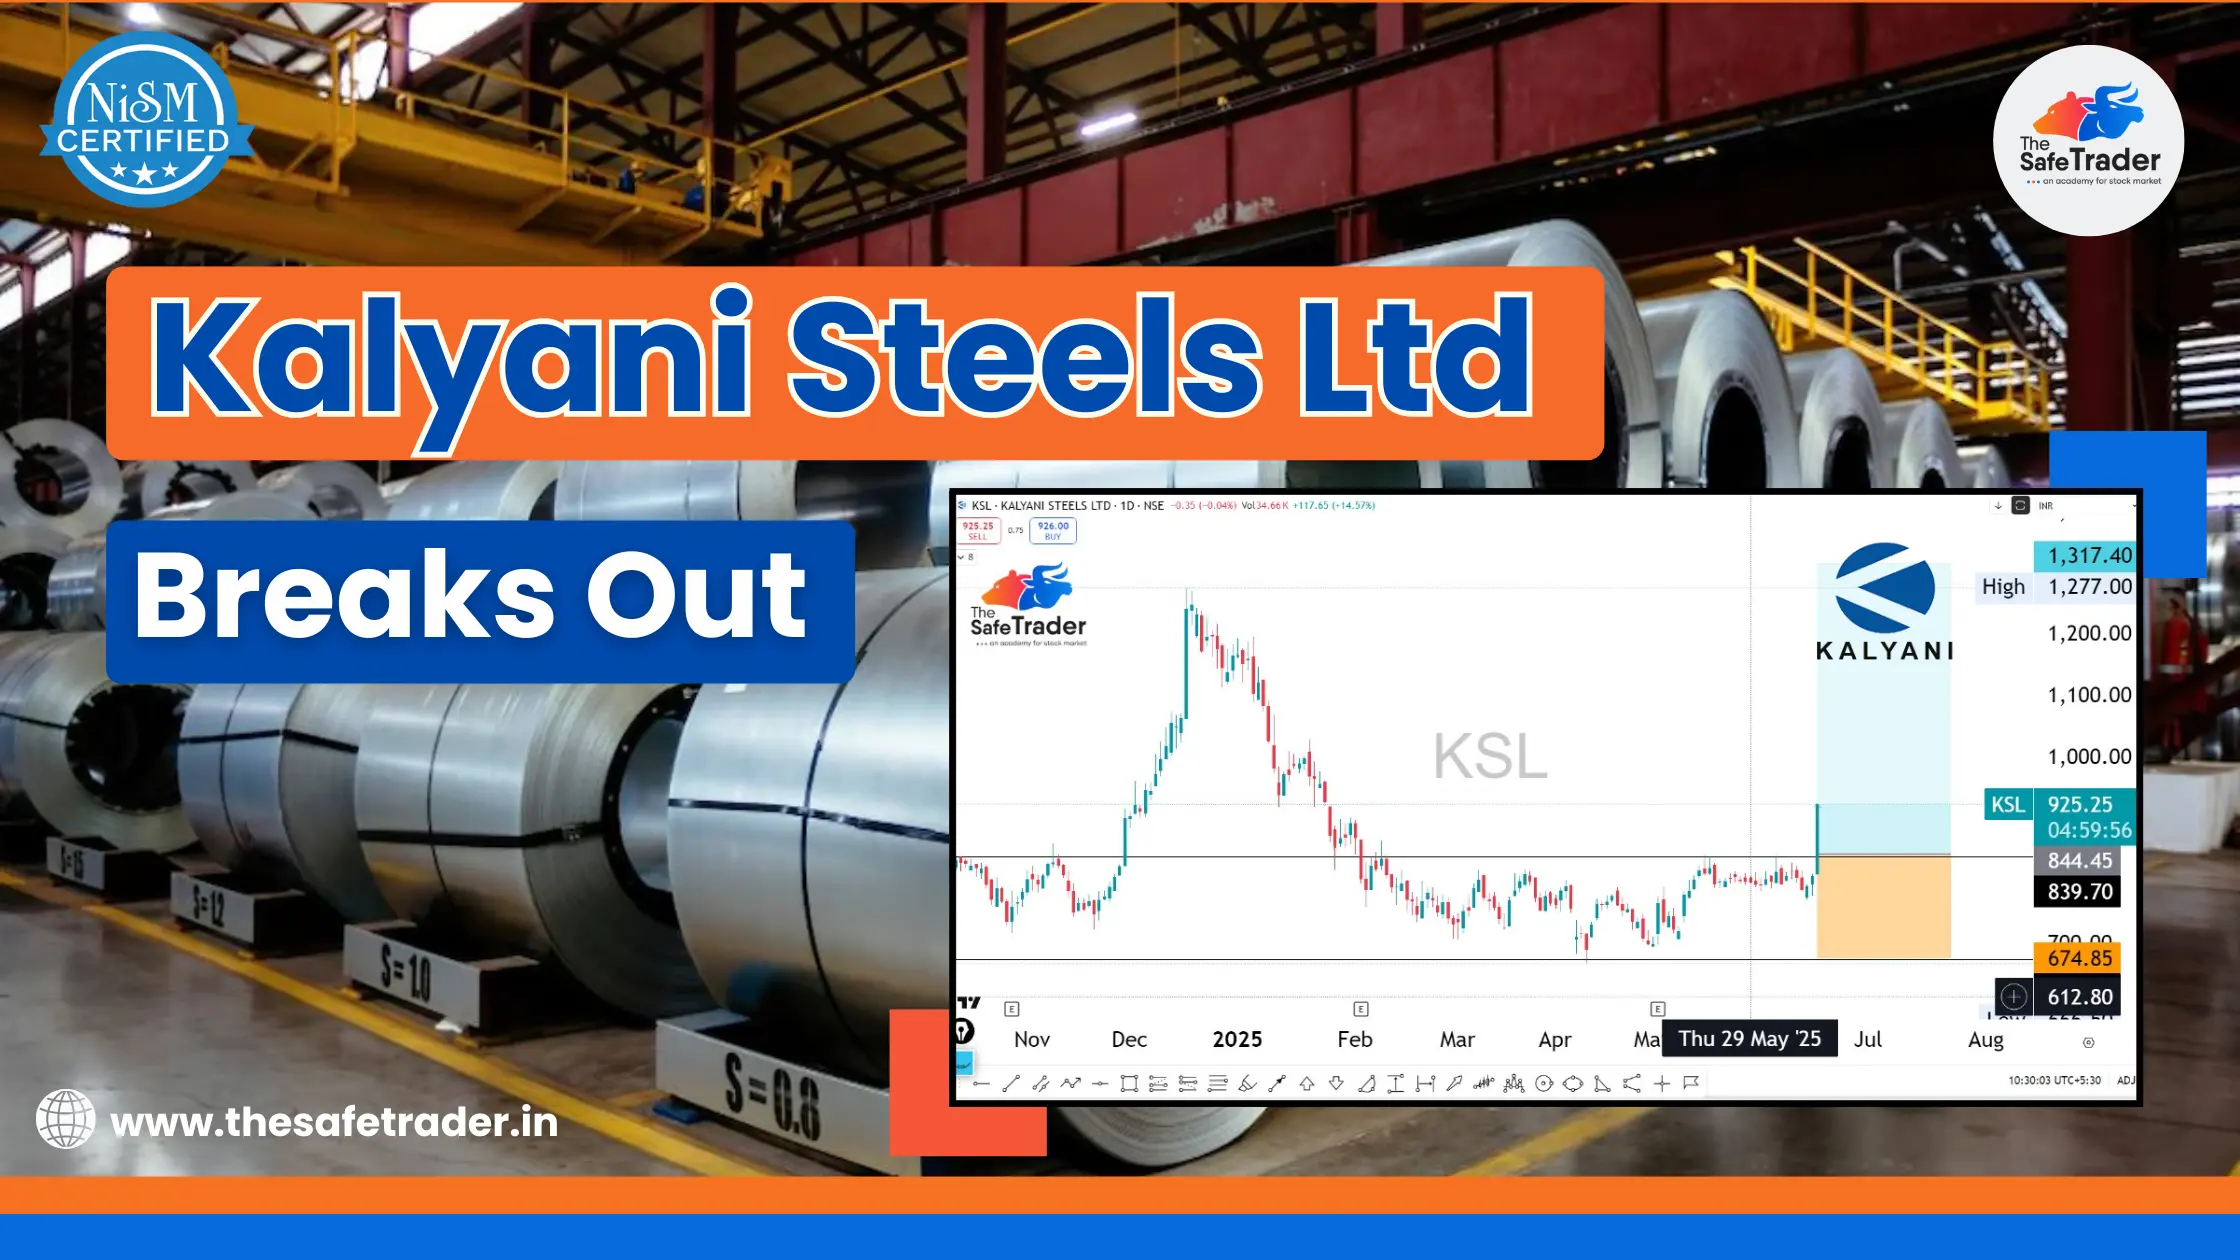
    After slipping sideways for months, Kalyani Steel Ltd has given bulls a reason to celebrate. On the 29th of May, 2025, the stock consumed a breakout above a very strong resistance level on huge volumes and bullish sentiment; this breakout shot the stock above 14.5% in a day and is now poised to mark the trend reversal, if not an all-out rally, in the coming months.

    But will the breakout remain sustained? Which price levels are of importance for the traders and investors to watch now?

    Let’s get into the technicals and payoff profiles along with alternate trade setups in KSL.

    Kalyani Steels Chart

    Technical Picture – Breakout Confirmed

    The chart clearly shows that KSL has been consolidating between the ₹675 to ₹840 zone for over 4 months. This kind of long consolidation often precedes a strong directional move, and KSL has delivered just that.

    Key Technical Highlights:

    • Breakout Date: May 29, 2025
    • Closing Price: ₹925.25 (Up +14.57%)
    • Resistance Broken: ₹840 (Major horizontal resistance)
    • Volume Spike: Strong volume confirms breakout legitimacy
    • Immediate Target Zone: ₹1,277 to ₹1,317 (based on previous swing highs)
    • Stop-Loss Zone: ₹674.85 (Below recent support)

    This is a classic breakout trade setup that fits well within a risk-managed strategy.

    Psychological Edge – Why This Matters

    Such breakouts after long-drawn consolidations typically denote a change in institutional behavior. The smart money tends to accumulate within sideways ranges, and momentum traders, retail participants, and algorithmic systems join the fray once a breakout occurs, hastening the price rally.

    The breakout seems more enticing, given its neat chart structure with a historical high zone at around ₹1,300, which is the new target.

    KSL: A Quick Fundamental Snapshot

    Kalyani Steels is a key player in the Indian alloy and special steel sector, supplying to automotive, engineering, and defense industries. India is currently emphasizing creating infrastructure, defense manufacturing, and ‘Make in India’–which means steel will see long-term demand.

    Recent triggers:

    • Improvement in margins due to control over raw material costs
    • Increasing demand from the automotive sector
    • Positive sentiment in the steel and metal index

    These factors complement the bullish technical setup.

    Risk-Reward & Trade Planning

    Let’s lay out a potential trading plan for both swing and positional traders:

    Trade ElementValue
    Entry Zone₹920 – ₹940
    Target 1₹1,277
    Target 2₹1,317
    Stop-Loss₹674.85
    Risk-Reward Ratio~1:2.5 to 1:3

    Note: Always manage position sizing based on risk tolerance. Do not chase after a gap-up; wait for pullbacks or consolidation near breakout zones.

    Trading Plan: How to Approach This Setup

    Let’s lay out a potential trading plan for both swing and positional traders:

    Strategy TypeEntry ZoneTarget ZoneStop-Loss
    Swing Trading₹915 – ₹935₹1,277 – ₹1,317₹675
    Long-Term InvestingOn dipsAbove ₹1,300+Below ₹650

    Tips for Traders:

    • Watch for price retests of the breakout zone (₹840–₹860) as potential re-entry points.
    • Track broader Nifty Metal Index movement for sectoral support.
    • Use trailing stop-loss as the price approaches ₹1,200+.

    ⚠️ Note: Always manage position sizing based on risk tolerance. Do not chase after a gap-up; wait for pullbacks or consolidation near breakout zones.

    Broader Market Context

    The breakout in Kalyani Steels occurs at a time when the metals sector is undergoing renewed strength with rising global demand and infrastructure push in India. If the Nifty Metal index continues to hold good, KSL can prove to be one of the best performers in the pack.

    Rising steel prices at the international level and government capex spending can help to sunset fundamentals.

    Why This Breakout Could Be Huge

    • Clean Base Formation: Months of concentration often generate explosive moves.
    • Sector Tailwinds: Steel sector early-stage signs of reversal are in evidence.
    • Volume Expansion: Rising volumes are good for the institutional buying buildup.
    • Favorable Risk-to-Reward Ratio: Near ₹900 entries with targets above ₹1,300 give RR of more than 1:2.

    Final Views: A Trend in the Making?

    The breakout in Kalyani Steels Ltd is not just a technical event—it might be the beginning of a structural uptrend. While short-term volatility may persist, the broader trend looks upward. Traders and investors should keep this stock on their radar and watch for sustained momentum in the days to come.

    •  As always, trade with discipline and manage your risk. Markets reward preparation, not prediction.
    Join Our Free Telegram Channel

    Disclaimer:
    The information provided here is purely for educational and informational purposes only and reflects our personal analysis and opinions. We are not SEBI-registered advisors. Please consult a qualified financial advisor before making any investment decisions.

  • Crude Oil Price on Fire: Nearly 37% in Just 39 Days

    Crude Oil Price on Fire: Nearly 37% in Just 39 Days

    Crude Oil Price on Fire

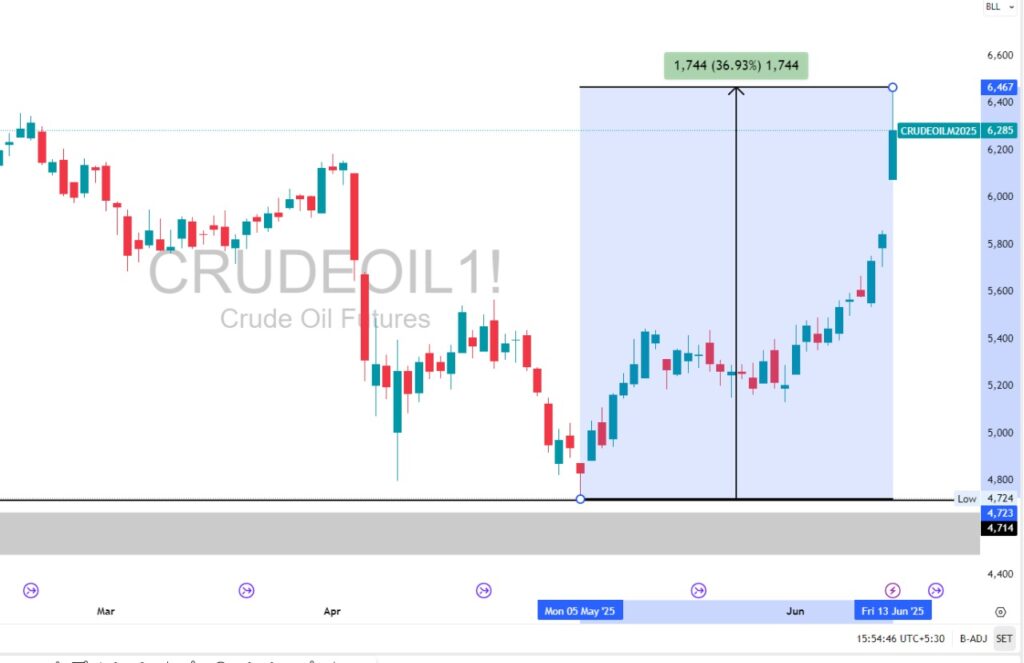
    Crude oil prices have recently taken traders and investors by surprise with a stunning 36.93% rally in just over a month. From ₹4,724 on May 5, 2025, to ₹6,467 on June 13, 2025, MCX Crude Oil Futures surged nearly ₹1,744, delivering one of the most powerful commodity rallies seen in recent months.

    This upward price movement is more than just numbers on a chart; it is a shift in market sentiment, altered fundamentals, and greater speculative activity. If you are any trader, investor, or market watcher, then this move holds lessons for you in price action, global macro trends, and trading psychology.

    What Triggered the Spike in Crude Oil?

    1. Middle East Geopolitical Tensions

    One of the main catalysts has been the escalating conflict between Israel and Iran. With the potential for disruptions in oil flow through the Strait of Hormuz — a key artery for global oil exports — traders and institutions rushed to hedge their positions, sending oil prices soaring.

    Fact: Nearly 30% of global crude oil passes through the Strait of Hormuz daily. Any instability here directly threatens global oil supply.

    2. Restrained Supply-Restraint Factor on Price & OPEC+ Competition

    Demand is consistently higher, while OPEC+ units, showing production restraint, refuse to drain the markets at these higher prices. The unplanned production outages in Libya and Nigeria also negatively affect supply. 

    3. Seasonal Demand Surge

    The season of baby travel is soon upon us; hence higher gasoline and diesel consumption levels will be recorded. Refineries are now upping crude lifting to meet this seasonal demand, adding to the tight supply situation.

    4. Speculative Buying & Technical Momentum

    The price action seen in this rally also reflects momentum-driven trading. Once crude broke past resistance levels, traders using technical indicators likely added fuel to the rally:

    • Breakout above resistance at ₹5,500 opened the door for ₹6,000+
    • Moving average crossovers and bullish RSI likely attracted algorithmic and institutional buyers
    Crude oil Chart

    Technical Analysis Breakdown

    From a chartist’s perspective, this rally is a textbook example of trend reversal and breakout momentum. Here’s the breakdown:

    FeatureDetail
    Lowest Point₹4,724 (on May 5, 2025)
    Highest Point₹6,467 (on June 13, 2025)
    Total Gain₹1,744
    Percentage Gain36.93%
    Trend PatternV-shape recovery with higher highs & higher lows
    Volume AnalysisIncreasing volumes confirming bullish strength

    The breakout above previous resistance zones, followed by strong bullish candles, indicates high conviction buying in the market.

    Key Takeaways for Traders

    The price action considered offers more than just profits — it provides learning opportunities for both novice and seasoned traders.

    Trend Identification: Early signals of reversals, including rejection wicks and higher-low formations, were cautions for active traders.

    Breakout Confirmation: Once crude broke out of consolidation near ₹5,500, momentum buyers shone in glory.

    Risk-Reward Payoff: Entries at the very start of the trend brought huge returns with risk under control. 

    🔑 Remember: Every rally brings the opportunity to make money — or for money to be lost if there is a reversal. In such fast-moving markets, technical stop losses become a must.

    Conclusion: Will the Rally Sustain?

    Crude oil’s recent bullish trend reminds us that commodities are high-beta assets — capable of both explosive rallies and sharp corrections. Whether you’re a short-term trader or a long-term macro investor, keeping an eye on technical signals, global news, and market sentiment is crucial.

    As we move deeper into 2025, watch how inventory reports, geopolitical developments, and central bank policies impact energy prices. For now, the bulls are clearly in control — but always stay prepared for the unexpected in commodity markets.

    👉 Join The Safe Trader Academy today and start trading like a pro.

    Join our free telegram channel

  • Top Bitcoin Holders in the World (2025)

    Top Bitcoin Holders in the World (2025)

    Top Bitcoin Holders in the World

    Bitcoin, the world’s first decentralized digital currency, has been around since 2009.  From an experimental project, it imparted to existence as a global financial asset that individuals and institutions have gathered huge quantities of BTC; even if Bitcoin promotes decentralization, a few entities hold about a huge percent of the total supply.

    This blog explores the 10 largest Bitcoin holders worldwide as per the last publicly available data in 2025.

    1. Satoshi Nakamoto – 1.1 Million BTC

    The anonymous creator of Bitcoin, called Satoshi Nakamoto, mined roughly 1.12 million BTC in the early days (2009-2010). These coins have never been moved, which really means it may have been an intentional act to promote Bitcoin decentralization. From a present value perspective, the BTC has an assumed worth of more than $70 billion and is distributed over ~22,000 addresses.

    Why it matters:

    The moment these coins are in recent times in motion, it can cause either massive loss of confidence or colossal volatility. 

    2. Coinbase (Exchange Wallets) – 1.05 Million BTC

    Coinbase, the largest U.S.-based crypto exchange, holds BTC in cold wallets on behalf of users. According to blockchain analytics, these wallets total around 1.05 million BTC.

    Note: These aren’t Coinbase’s proprietary assets but user-deposited funds.

    3. Binance – 650k to 765k BTC

    Binance holds between 650,000–765,000 BTC in custody. Being the largest crypto exchange worldwide in trading volume, their reserves are spread over multiple wallets, and the actual holdings are published periodically in the transparency reports.

    Why it matters: 

    The holdings of Binance represent a significant amount of global liquidity.

    4. BlackRock (IBIT ETF) – 550k+ BTC

    In 2024, BlackRock launched iShares Bitcoin Trust (IBIT), igniting gigantic institutional interest. By mid-2025, the ETF held 550,000+ BTC, making it the largest holder in the spot ETF.

    Impact: 

    Institutional adoption continues to impart legitimacy and stability to the market.

    5. MicroStrategy – 499k BTC

    Under the Bitcoin bullish leadership of Michael Saylor, MicroStrategy has acquired nearly 499,000 BTC. The company still purchases Bitcoin as a treasury asset, supported by bonds and convertible notes.

    Implication:

     MicroStrategy is the largest public BTC holder as an instance of a Bitcoin-backed balance sheet.

    6. Grayscale Bitcoin Trust (GBTC) – 220k BTC

    Once the dominant U.S. Bitcoin investment vehicle, Grayscale’s GBTC still holds around 220,000 BTC. Despite recent outflows due to ETF competition, GBTC remains a major player.

    Investor Note:


    Grayscale’s holdings are now more transparent, aligning with SEC ETF conversions.

    7. U.S. Government – 213k BTC

    The U.S. government has seized BTC through law enforcement operations (Silk Road, Bitfinex hack, etc.). These assets are stored by the U.S. Marshals Service and sold via auctions, though a large amount remains unsold.

    Interesting Fact:


    The U.S. is now among the largest nation-state holders of Bitcoin.

    8. Bitfinex – 359k BTC

    Bitfinex, one of the earliest and most influential exchanges, holds over 359,000 BTC in cold wallets. These holdings reflect both user balances and company reserves.

    Security Note:
    Despite a history of hacks, Bitfinex has since improved wallet transparency and multisig protocols.

    9. Kraken – 237k BTC

    U.S.-based exchange Kraken stores around 237,000 BTC, primarily in cold storage for user assets. Known for compliance and transparency, Kraken is a major BTC custodian for U.S. customers.

    10. Wrapped Bitcoin (WBTC) – 176k BTC

    WBTC is a tokenized form of BTC on Ethereum, fully backed 1:1 by Bitcoin. These tokens allow BTC holders to participate in DeFi. The reserve BTC is held by BitGo and verified via on-chain audits.

    Honorable Mentions

    HolderBTC HeldNotes
    UK Government~61k BTCSeized through criminal investigations.
    China Government~194k BTCConfiscated from Ponzi schemes & illegal mining.
    North Korea (Lazarus)~13.5k BTCStolen by cyberattacks.
    Bhutan~13k BTCMined using hydroelectric energy.
    El Salvador~6k BTCFirst country to adopt BTC as legal tender.

    How Many Bitcoins Are Left?

    As of 2025, approximately 1.3 million BTC remain to be mined, with the final BTC expected around 2140. A large chunk of coins (est. 3–4 million) are permanently lost due to lost keys or unspendable wallets—tightening overall supply.

    Bitcoin Distribution – Who Really Owns BTC?

    • Top 2% of addresses hold >90% of Bitcoin.
    • Over 1 million addresses hold at least 1 BTC.
    • More than 3 million BTC are estimated to be lost forever due to lost private keys or wallets.

    Final Thoughts: Why Bitcoin Distribution Matters

    Understanding who the largest holders of Bitcoin are lets us analyze considerations for liquidity into the market, a centralization risk, and some level of geopolitical interest. Be it the mad scientist of technology himself, Satoshi; a corporate strategist like Michael Saylor; or a government agency holding seized coins-the concentration of BTC directly affects:

    • Price volatility
    • Regulatory decisions
    • Investor sentiment

    As Bitcoin grows up, transparent ownership and responsible custody will exert greater influence on its future.

    FAQs

    1 Are these holdings public?

    Yes, the blockchain is transparent so analysts can verify wallet balances, though several wallet identities remain anonymous.

    2 What happens if a government sells its Bitcoin?

    Such an event normally brings about temporary price dips as was experienced during the US Marshals auctions, but the markets absorb them pretty much quickly.

    3 How does an ETF hold Bitcoins?

    An ETF purchases and stores BTC via a trusted custodian (e.g., Coinbase Custody) and then issues shares that are backed by real Bitcoin.

    4 Is Satoshi’s Bitcoin lost?

    It is unclear. The Bitcoins haven’t moved for over a decade; however, from a technical perspective, they still can be moved if their private keys exist.

    👉 Join The Safe Trader Academy today and start trading like a pro.

    Join Our free Telegram channel