Tesla’s entry into India marks a big step for clean mobility in the country.
Teslaopened its first showroom in India on July 15, 2025, in Mumbai’s upscale Bandra-Kurla Complex (BKC) business district. The showroom has Model Y cars on display, areas for customers to experience the vehicles, and Tesla staff ready to give advice and take orders.
Key Highlights
Tesla Model Y officially launched in India
Starting price: ₹61 Lakh
First showroom opened on July 15, 2025, in Mumbai
Deliveries to begin in Q4 2025
Tesla Supercharging and charging partnerships underway
Tesla Model Y: India-Spec Overview
The Model Y, Tesla’s high-end electric SUV, has gained fame worldwide for its good fuel use strong performance, and simple modern look. It’s built on the same base as the Model 3 and combines practicality with top-notch electric car tech.
Feature
Details
Range (WLTP)
Approx. 505 km
0–100 km/h
Around 5.0 seconds
Drivetrain
Dual Motor All-Wheel Drive
Charging Support
Superchargers + Type 2 Support
Seating
5 standard, optional 7-seater
Interior
Premium, minimalist design
Tesla’s Roadmap in India
Tesla’s strategy in India focuses on a phased rollout, beginning with the growth of retail and infrastructure in major metro areas.
In India, the Tesla Model Y’s price begins at ₹59.89 lakh for the Standard range version and goes up to ₹67.89 lakh for the Long Range version. The total cost, including taxes and fees, for the Tesla Model Y in Mumbai is likely to be between ₹61.07 lakh and ₹69.15 lakh, depending on which version you choose.
People can sign up to buy the car in Mumbai, Delhi, and Gurugram. They can also order the car on Tesla’s website. The company plans to start delivering the rear-wheel drive model in the current July-September quarter. The long-range version will start reaching customers in the October-December quarter this year.
Future Indian Tesla Launches
Following the Model Y, Tesla is expected to release:
Tesla’s best-selling sedan is the Model 3.
Premium luxury models for specialized consumers are the Model S and Model X.
Phased releases of these models are planned to start in mid-2026.
Final Thoughts
With the introduction of the Model Y and the opening of its showroom in Mumbai, Tesla’s debut in India represents a major advancement for the nation’s EV ecosystem. Indian customers will gain uncommon access to top-notch technology, sustainability, and performance as Tesla expands its business.
New York-based trading giant Jane Street Grouphas made a significant step towards restarting its business in India. The company has fully complied with a recent order from India’s market regulator, SEBI, by paying an astounding ₹4,843.57 crore (roughly $567 million) in an escrow account.
This move directly addresses a July 3, 2025, interim order from SEBI accusing the Wall Street company of manipulating the Indian derivatives market, particularly Nifty futures.
Jane Street has formally requested that SEBI lift the trading ban in light of the deposit. SEBI has acknowledged this request and said it’s currently under review.
Quick Recap:
Why Was Jane Street Banned in the First Place?
On July 3, SEBI:
Charged Jane Street with manipulating market prices through aggressive trading strategies in futures and options.
Directed the company to pay ₹4,843.57 crore, stating that it was due to wrongful trading profits.
Complete ban was issued, disallowing Jane Street and its group from trading in Indian markets.
Directed custodians, depositories, and banks to freeze the firm’s assets pending compliance.
Deposit Done – So, Is the Ban Over?
Yes – but with conditions.
What’s Changed:
Jane Street has made the deposit as instructed.
As per Clause 62.11 of SEBI’s order, this compliance technically lifts the trading restrictions.
The company can now resume trading on Indian exchanges-but with important limitations.
What Still Applies:
Jane Street is prohibited in its entirety from employing the manipulative trading strategies that resulted in SEBI taking its initial action.
The company has to “cease and desist” from doing anything that looks manipulative or unfair in terms of Indian market regulations.
SEBI has requested exchanges to closely monitor Jane Street’s activity in the future.
What Is Jane Street Saying?
Jane Street has strongly denied all allegations. In internal communications:
The firm called SEBI’s findings “inflammatory”, saying they misunderstood a standard hedging/arbitrage practice.
The company says it was carrying out a typical arbitrage trade on January 17, 2024, the major trading day that SEBI highlighted, rather than manipulating prices.
Jane Street reported it had even voluntarily paused trading following feedback from NSE, and adjusted its approach accordingly.
Legal Showdown on the Horizon?
Even though the deposit has been made, Jane Street hasn’t backed down.
SEBI has granted the firm 21 days to respond and seek a hearing.
Sources indicate the firm will appeal the order in the This legal challenge Securities Appellate Tribunal (SAT).
If it succeeds, Jane Street might be able to get back the escrowed money and possibly clear its name.
This legal challenge may establish a significant precedent for the regulation of foreign algorithmic trading firms in India.
What Does This Mean for Traders and the Market?
After the initial ban, F&O (futures and options) volumes dropped by 20%, indicating Jane Street’s substantial influence in that market.
Liquidity may improve as a result of their potential return, particularly in Nifty and Bank Nifty contracts.
However, SEBI’s firm stance demonstrates its commitment to limiting high-frequency trading and shielding individual investors from market manipulation.
Conclusion:
Jane Street’s ₹4,843.57 crore deposit represents a significant compliance milestone, the fight is far from over.
The firm still faces:
Reputational pressure
Legal scrutiny
Intense regulatory oversight in one of the world’s fastest-growing markets
Jane Street’s legal approach, SEBI’s review, and the possible repercussions for India’s financial system will all be closely watched in the coming weeks.
Disclaimer: The information provided here is purely for educational and informational purposes only and reflects our personal analysis and opinions. We are not SEBI-registered advisors. Please consult a qualified financial advisor before making any investment decisions.
Glenmark Pharmaceuticalswitnessed a strong rally in its stock price on Friday, July 11, closing 10% higher and locking into the upper circuit. The rise followed the announcement by Ichnos Glenmark Innovation (IGI), its innovation subsidiary, of a historic worldwide licensing deal for the oncology asset ISB 2001 with US biopharma giant AbbVie.
With a potential value of $1.925 billion, the deal is the biggest licensing agreement ever made by an Indian pharmaceutical company and greatly enhances Glenmark’s standing in the global oncology and innovation market.
1,200% Returns Since Lockdown Lows:
Over the past few years, Glenmark Pharma has produced remarkable stock market returns. During the lockdown of the epidemic at a price of ₹ 160, the stock has now climbed ₹ 2,094 per share, translating into 1,200% returns. The latest 10% jump adds to a strong speed that has seen more than 28% stock profit in the previous month.
On July 11, the rally was inspired by heavy investor interest, in which the trading volume reached 0.70 lakh shares-more than 0.27 lakhs than an average of two weeks.
Inside the AbbVie-Glenmark Licensing Deal:
As per the terms of the agreement, IGI Therapeutics SA, a subsidiary of Ichnos Glenmark Innovation Inc., has licensed out its top-line investigational asset ISB 2001 to AbbVie, with exclusive development and commercialisation rights in top global markets such as the US, Europe, Japan, and China.
Glenmark Pharma retains commercialization rights in India and emerging economies in Latin America, Middle East, Africa, Russia/CIS, Australia, New Zealand, South Korea and the and the rest.
Deal Highlights:
$700 million upfront payment to IGI
Development, regulatory and commercial milestones pay $ 1.225 billion
Tiered, double-digit royalties on net sales globally
This agreement underscores the global credibility of IGI’s BEAT® protein platform, and validates Glenmark’s long-term focus on innovation.
Strategic Market Positioning:
Under the licensing agreement, Glenmark will lead commercialisation across all emerging markets whereas AbbVie shall have responsibility for development and sales in North America, Europe, Japan, and Greater China. Such a dual-framework enables Glenmark to:
Long -term royalty revenue safe from developed markets
Expand direct access to development markets in Asia, Latin America and Africa
Create reliability in global oncology innovation
The deal also aligns Glenmark with a top-tier global partner, giving its drug development programs a significant boost in both capital and capability.
Cyril Konto, M.D., President, Executive Director, and CEO of IGI, said:
“Our collaboration with AbbVie and Glenmark highlights IGI’s mission to accelerate access to transformative multispecifics globally. AbbVie’s presence in major markets and Glenmark’s stronghold in emerging regions offer complementary access strategies for ISB 2001, which shows strong promise in multiple myeloma.”
Conclusion
10% rally in Glenmark Pharma shares operate more and more than emotions – it demonstrates a strategic shift of the firm, which is supported by global partnership. Glenmark Pharma has rewritten its future trajectory with this deal. Company steps towards innovation and licensing bring new avenues not just for their shareholders but to Indian pharma as well. All eyes are now in clinical progress of ISB 2001 and Glenmark’s developed innovation pipeline.
Disclaimer: The information provided here is purely for educational and informational purposes only and reflects our personal analysis and opinions. We are not SEBI-registered advisors. Please consult a qualified financial advisor before making any investment decisions.
Master Tried-and-True Techniques with The Safe Trader Academy
Trading dramatically improves when you follow a disciplined approach. It’s time to start trading more intelligently if you’re tired of the stock market’s unstable performance. At The Safe Trader Academy, we support education that is both useful and effective. Our professionals have created a straightforward, successful 30-day trading discipline plan that will improve your trading performance and help you form lasting routines.
For 30 days, follow these 8 steps to significantly change your trading:
1. Decide on a Timeline
Identify and adhere to your trading style, whether it be positional, swing, or intraday.
2. Develop a Trading Strategy Based on Your Risk/Reward
Develop a rule-based strategy that is consistent with your desired risk-reward ratio and eliminates emotions.
3. Evaluate Position Volatility and Size
Adjust the lot size according to market volatility and only take on risk that you can afford to lose.
4. No Random Trades
Never make a snap decision; every trade should have a solid setup or justification.
5. Keep a Positive Mindset
Maintain your composure during drawdowns and have faith in your system; trading success begins in the mind.
6. Keep Up With Your Studies
Because markets are constantly shifting, keep learning about technicals, fundamentals, and price behavior.
7. Maintain Discipline
Follow through on your plan; without discipline, even the best plan will fail.
8. Look At Every Trade End
Keep track of every trade you make, learn from your mistakes, and keep refining your process if you want to succeed in the long run.
What Makes The Safe Trader Academy the Best Option?
The first step to financial freedom is selecting the appropriate share market institution. In addition to theory, The Safe Trader Academy offers a hands-on, immersive, and real-time experience that equips each student to become a profitable, self-assured trader. Over 5,000+ students in India and overseas trust us.
We rank among the top stock market courses in India for the following reasons:
✅ Tools & Software for Trading & Investing ✅ Basics of Indian Share Market ✅ Equity Investment ✅ Fundamental & Technical Analysis ✅ Futures & Options ✅ Forex & Commodity Trading ✅ Powerful Intraday Trading Strategies ✅ Online & Offline Classes Available ✅ Live Market Analysis & Handholding (3 Months) ✅ 500+ Real-Time Market Assignments ✅ One-on-One Interaction with our Trainer & CEO ✅ Zoom Recordings for Every Class
The Safe Trader Academy is pleased to serve students throughout India by providing both online and in-person share market courses. We offer a variety of options to meet your needs, regardless of if you would rather learn from the comfort of your home or attend one of our centers for in-person instruction.
Stock Market Courses In Hyderabad | Stock Market Courses In Delhi | Stock Market Courses In Mumbai | Stock Market Courses In Pune | Stock Market Courses In Bengaluru | Stock Market Courses In Ahmedabad | Stock Market Courses In Chennai | Stock Market Courses In Visakhapatnam | Stock Market Courses In Vijayawada | Stock Market Courses In Patna | Stock Market Courses In Bhopal | Stock Market Courses In Lucknow | Stock Market Courses In Kolkata | Stock Market Courses In Thiruvananthapuram | Stock Market Courses In Warangal | Stock Market Courses In Tirupati
The Safe Trader Academy has everything you need in one place, whether you’re looking for the best stock market course or need convenient online stock market classes.
Visit : www.thesafetrader.in Contact us : +91 9297506666
Analyzing market sentiment forms the base for decision making in Options Trading. Put-Call Ratio, one of the most widely used tools to measure sentiment, presents a view of whether a set of investors is predominantly bullish or bearish. But what exactly is the PCR in an option chain, and how does one put it to use? Let’s go ahead and discuss.
What is PCR (Put-Call Ratio)?
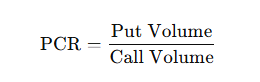
Put-Call Ratio (PCR) is a sentiment measure derived by dividing the open interest (OI) or volume of put options by that of call options for a particular stock or index.
Traders often consider the PCR calculated from Open Interest (OI) because OI represents positions still being held by traders, giving better insights into sentiment.
Types of PCR
PCR based on Volume
Indicates short-term trading interest in puts versus calls.
PCR based on Open Interest (OI)
Preferred analysis of positional and medium-term sentiment.
Index PCR (like Nifty PCR, Bank Nifty PCR)
The Index PCRs are closely tracked by F&O traders for the purpose of getting some feel of the broader market trends.
How to Read PCR from an Option Chain?
An option chain is a table with call and put options available for a particular underlying asset. It shows parameters such as strike prices, open interest, volume, and bid/ask prices, among others.
How to calculate Put Call Ratio in stock market:
There are two well-known ways of calculating the PCR:
To find the PCR from the option chain:
PCR (Open Interest):
Sum the Open Interest (OI) of all Put options.
Sum the Open Interest (OI) of all Call options.
Divide Put OI by Call OI.
PCR (Volume):
Most traders refer to the Open Interest PCR because it shows the outstanding positions traders are carrying.
Example:
Let’s consider the Nifty 50 option chain:
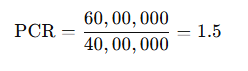
Total Put Open Interest = 60,00,000
Total Call Open Interest = 40,00,000
A PCR of 1.5 indicates that this index is bearish, but with so much bearishness, there also remains the possibility of a rally.
How to interpret PCR in options trading:
PCR > 1
When PCR is greater than 1, it means more puts are being traded than calls. Interpretation: Bearish sentiment — traders are buying more puts expecting a price decline.
PCR < 1
When PCR is less than 1, it means more calls are being traded than puts. Interpretation: Bullish sentiment — traders are buying more calls expecting a price rise.
PCR = 1
Equal number of puts and calls — indicating a neutral sentiment in the market.
Extremely High or Low PCR:
Very high or very low PCR values can sometimes signal contrarian opportunities — meaning the market might be overbought or oversold.
Example:
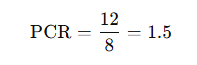
If the Nifty’s put open interest is 12 lakh and the call open interest is 8 lakh:
This suggests more traders are hedging or betting on a downside move.
However, extreme PCR values can indicate contrarian signals:
A very high PCR (>1.5) could mean excessive pessimism → market might rebound.
A very low PCR (<0.5) could signal excessive optimism → market might correct.
How Traders Use PCR in Strategy?
Traders use PCR to understand market sentiment and identify possible reversals.
PCR Value
Market Sentiment
Possible Interpretation
< 0.7
Extremely Bullish
May signal overconfidence — trend reversal possible
0.7 – 1.0
Mildly Bullish
Normal bullish sentiment
1.0 – 1.3
Mildly Bearish
Normal bearish sentiment
> 1.3
Extremely Bearish
May signal panic — potential bottom or reversal
Contrarian traders use high or low PCR to take opposite trades anticipating a reversal.
Why is PCR Important for Traders?
Sentiment Gauge: Determines whether the crowd is bullish or bearish.
Contrarian Indicator: The extreme levels of PCR interfere, thereby helping in identifying reversal zones.
Decision Support: Helps support decision-making in options trading strategies.
Limitations of PCR
PCR is a sentiment indicator and hence should never be interpreted as a buy or sell signal.
It has to be read while taking into consideration the price action, support/resistance levels, and volume.
Sudden increases in OI due to hedging or rollovers could lead to distorted PCR readings.
Practical Tip: Combine PCR with Technical Analysis
For better accuracy, combine PCR values with:
RSI, MACD, Moving Averages
Support & resistance zones
Option writing data and Max Pain levels
Conclusion:
One of the strongest but simplest indications of market sentiment in the option chain stands tall in the Put-Call Ratio (PCR). While not a crystal ball, the option chain would certainly help better time your trades when coupled with technical and fundamental analysis, rather than purely going by emotion.
Whether a novice or an experienced trader, monitoring PCR values from the option chain can give a strong edge to any trader.
Frequently Asked Questions (FAQs)
1. What is a good PCR value for a bullish market?
Pearl-chain below 1 (0.7 and 0.8) is considered a bullish bias in the market.
2. Can PCR be used for intraday trading?
Yes, but ideally, volume-based PCR for intraday and OI-based PCR for positional trades should be used.
3. Is a very high PCR always bearish?
Not necessarily. A high PCR might state excessive fear and set the stage for a reversal — a contrarian bullish signal.
Stock Markets are not just about the buying and selling of shares. Both the company and corporate actions can have an adverse impact on stock price, ownership structure, and investor value. Three common terms one comes across are: Offer-for-Sale (OFS), Rights Issue, and Bonus Shares.
These mechanisms operate toward very different ends-from raising money, rewarding shareholders, or meeting regulatory compliance. Let’s delve deep into the significance of these terms, how they work, and what an investor should beware of.
Offer-for-Sale – An Easy Mode of Disinvestment
An Offer-for-Sale permits the promoters of a listed company to sell a portion of their shareholding to the public by way of a stock exchange platform. No fresh issue of shares is involved, unlike an IPO (Initial Public Offering). It’s rather a transfer of ownership from existing holders to a set of new investors.
Real-World Example:
In 2023, the Government of India divested its stake in Hindustan Aeronautics Ltd (HAL) through OFS. The issue was kept open for one single day, with shares being offered at a slight discount, and the response was overwhelming from both retail and institutional investors.
How Does an Offer For Sale Work?
Now that you know what OFS is, let’s understand how OFS works. An Offer for Sale (OFS) is a process where a company or its major shareholders sell their shares to the public. Here’s how it works:
1. Announcement: The seller announces the OFS and sets a minimum price (floor price) for the shares on the stock exchange.
2. Bidding: Investors can place bids for the shares at or above this minimum price during the bidding period.
3. Allocation: The seller reviews the bids and decides how many shares each bidder gets based on their offers.
4. Settlement: Successful bidders have the shares credited to their accounts and the payment is deducted from their bank accounts.
If bids are lower than the floor price, OFS fails and shares stay with the seller. OFS helps companies raise funds efficiently and meets regulatory requirements for public shareholding.
How to Participate in OFS:
You have to put your bid through your stock broker.
Bidding is done during market hours, usually from 9:15 AM to 3:30 PM.
You can view the floor price (minimum offer price) before placing a bid.
Allotment is based on demand and bid price, and shares are credited to your Demat account.
Benefits & Risks:
Pros
Cons
Opportunity to buy quality stocks at a discount
Limited bidding time
Transparent mechanism on exchange
Allotment not guaranteed
Encourages wider retail participation
Price may fall after OFS due to oversupply
Rights Issue – A Call to Existing Shareholders
A Rights Issue permits a corporation to raise capital without incurring any loan or debt. This typically involves the offer to subscribe to additional shares at a discounted price-the discount having been calculated in a specified ratio between the points of time.
Example:
In 2020, Reliance Industries Limited (RIL) issued a rights issue for ₹53,125 crore-the highest ever in Indian history. Shares were offered in the ratio of 1:15 at ₹1,257 per share when market prices were at more than ₹1,400.
What can shareholders do?
The shareholders can subscribe to the rights issue and buy new shares.
They can renounce these rights and sell them in the market if they do not wish to subscribe.
They can simply choose to ignore their rights, but this may dilute their ownership.
Some Common Use Cases:
To fund expansions and projects.
To improve financial health or repay loans.
To avoid increasing debt burden.
Benefits & Risks:
Pros
Cons
Discounted price to buy more shares
May need to invest more capital
Avoids debt, strengthens balance sheet
Ignoring may dilute your shareholding
Right renunciation allows liquidity
Lower investor enthusiasm can depress stock
Bonus Shares – A Reward for Loyalty
Bonus Shares are issued when a company wants to share its profits with shareholders without paying out actual cash. It is like a gift — more shares for free, in proportion to your current holdings.
Recent Example:
In 2022, TCS declared a 1:1 bonus from 1:1; an extra share was given for every share held. This bonus stock issued increased liquidity and attracted retail interest.
Accounting Behind Bonus:
Bonus shares are issued from reserves or from surplus profits; hence no new capital is raised. While your shares increase in number, the price of the stock adjusts so that the total value of your investment remains the same initially.
Common Ratios for Bonus Issues:
1:1 (1 share for every 1 held)
1:2 (1 share for every 2 held)
2:5 (2 shares for every 5 held)
Benefits & Risks:
Pros
Cons
No cost involved
Price gets adjusted, no real gain
More shares can mean better liquidity
No impact on company fundamentals
Perceived positive signal from management
Earnings per share (EPS) may reduce
Summary Table: OFS vs Rights vs Bonus
Feature
Offer-for-Sale (OFS)
Rights Issue
Bonus Shares
Purpose
Promoters reduce stake
Company raises capital
Distribute surplus to shareholders
Who gets it?
Public investors
Existing shareholders
Existing shareholders
Price
At discount to market
Discounted price
Free
Capital Raised?
No
Yes
No
Shareholder Dilution
No (transfer only)
Yes, if not subscribed
No real dilution
Timeline
1–2 days
15–30 days
Declared + credited
Investor Insights – What Should You Do?
Corporate Action
What Should You Do as an Investor?
OFS
Look at the valuation and discount offered. Use retail quota if available.
Rights Issue
Assess the reason for capital raising. Subscribe if the company has strong fundamentals.
Bonus Shares
Enjoy the benefit! Keep holding for long-term gains. It may improve liquidity and stock appeal.
Conclusion
Understanding corporate actions like OFS, Rights Issues, or Bonus Shares can allow you to spot opportunities and avoid surprises. If you are building a portfolio with a long-term horizon or are making short-term bets, awareness of these events is a clear edge.
They are more than just administrative changes by companies; they are strategic signals. Always contemplate their impact on shareholding, capital structure, and stock price before taking action.
Most investors are aware of the usual valuation tools like Price/Earnings ratio that most investors use when trying to ascertain a company’s worth. But, analysts tend to go above that and use advanced, more insightful metrics such as EV/EBITDA and EV/EBIT. These two enterprise value ratios are especially handy for spotting undervalued stocks and comparing companies across industries and geographical locations.
In this straightforward blog, we will explain EV/EBITDA and EV/EBIT in detail, how to track them, when to apply them, and why many times they are better than traditional ratios.
What is Enterprise Value (EV)?
Enterprise Value (EV) is a measure of a company’s total value, reflecting not just its market capitalization, but also its debt and cash positions.
Formula:
Enterprise Value (EV) = Market Capitalization + Total Debt – Cash & Cash Equivalents
EV represents the theoretical takeover cost of a company—it’s what a buyer would pay to acquire the business, including its debt, minus its available cash. That’s why EV is considered a more accurate reflection of a firm’s value than just its market cap.
What is EV/EBITDA?
The full form of EV/EBITDA is Enterprise Value to Earnings Before Interest, Taxes, Depreciation, and Amortization. This ratio measures the value of a company relative to some measure of operating performance.
Formula:
EV/EBITDA = Enterprise Value / EBITDA
Highlights:
Removes non-cash charges (depreciation and amortization)
Shows variations in tax and interest
Useful when comparing companies having a different capital structure
Ideal for:
Capitallight companies such as tech, IT services, and consulting
Cross-border company comparisons where tax regimes differ.
What is EV/EBIT?
EV/EBIT, or Enterprise Value to Earnings Before Interest and Taxes, is another popular ratio used to value businesses. Unlike EBITDA, EBIT includes depreciation and amortization, with the latter being a more conservative view of the company’s profits.
Formula:
EV/EBIT = Enterprise Value / EBIT
Key Features:
Includes depreciation and amortization
Highlights operational efficiencies at the core
Better reflects long-terms costs of assets
Best For:
Capital-intensive industries-like manufacturing, telecom, power buildings
Companies with high capital expenditures (CapEx)
EV/EBITDA vs. EV/EBIT: Key Differences
Feature
EV/EBITDA
EV/EBIT
Depreciation Included?
❌ Excluded
✅ Included
Profitability View
Optimistic
Conservative
Cash Flow Proxy
Stronger for short-term
Weaker for CapEx-heavy companies
CapEx Consideration
Ignores CapEx impact
Reflects CapEx through depreciation
Ideal For
Asset-light industries
Asset-heavy industries
Real-World Example: Indian Stocks
Company
Enterprise Value
EBITDA (₹ Cr)
EBIT (₹ Cr)
EV/EBITDA
EV/EBIT
Sector
Infosys
₹6,50,000 Cr
₹39,000
₹33,000
16.6x
19.7x
IT Services
Tata Motors
₹2,70,000 Cr
₹23,000
₹16,500
11.7x
16.3x
Auto & EV
Power Grid
₹2,00,000 Cr
₹27,800
₹21,100
7.2x
9.5x
Power Utility
L&T
₹3,00,000 Cr
₹27,000
₹21,000
11.1x
14.3x
Infrastructure
These figures show that different sectors demand different valuation lenses. For instance, Power Grid’s low EV/EBITDA and EV/EBIT may indicate undervaluation, but require deeper context like regulatory environment, debt load, and future CapEx.
P/E vs. EV/EBITDA & EV/EBIT
Ratio
Based On
Ignores Debt?
Ignores CapEx?
Adjusted for Cash Flow?
P/E
Net Income
❌ No
✅ Yes
❌ No
EV/EBITDA
Operating Earnings
✅ Yes
✅ Yes
✅ Closer Proxy
EV/EBIT
Operating Earnings
✅ Yes
❌ No
✅ More Conservative
✅ EV-based metrics offer a truer picture of the company’s operational value because they include debt, exclude cash, and focus on earnings before interest and tax effects.
When to Use EV/EBITDA vs. EV/EBIT
Use EV/EBITDA When:
Looking at early-stage or growth companies
Comparing firms in countries with differing tax regimes
Looking at operating cash flow over the short term
Working in asset-light industries
Use EV/EBIT When:
Looking at mature or capital-intensive companies
Estimating profitability in the long run
Adjusting for depreciation-heavy kind of industries
Looking for conservative valuations
Practical Implications for Investors
Use Peer Comparison: Compare EV/EBITDA or EV/EBIT with the averages for the industry.
Analyze Trends: A slipping EV/EBITDA may be a good sign that fundamentals are getting better or that the stock is undervalued.
Avoid One-Year Snapshots: Use three to five-year averages for better accuracy.
Cross-Validate with Other Ratios: Typically, EV/EBIT is combined with other ratios so one of the common combinations is EV/EBIT with ROCE, Debt/Equity, or Free Cash Flow Yield.
Be Wary of Outliers: A very low ratio can sometimes signal trouble, instead of opportunity.
Common Mistakes to Avoid
Comparing across unrelated sectors (say FMCG being compared to Power)
Ignoring leverage: EV includes debt, whereas EBITDA does not
Depending on EBITDA: It can conceal real CapEx needs
Using unadjusted figures: Always normalize for one-time income/expenses
Conclusion: EV-Based Multiples for Smarter Investing
Whether you are a beginner learning about stock valuation metrics, or a seasoned investor deep into fundamental analysis, the use of EV/EBITDA and EV/EBIT will give you a better perspective regarding a company’s financial health. These ratios transcend superficial profits, taking debt and cash flow potential and operating low efficiency into account.
✔ ️ Use EV/EBITDA with companies fast-growing and capital-light.
✔ ️ Use EV/EBIT for mature asset-heavy businesses where depreciation matters.
Combine the two, and a more nuanced adjusted-for-risk understanding of the company’s true value will come to you-a capability every smart investor needs in today’s fast-moving market.
Investment returns are evaluated differently by numerous investors — some consider capital gains, and yet others consider annual returns. This is where the role of CAGR or Compound Annual Growth Rate becomes crucial. What is CAGR exactly, and how do you fathom it? Let us deconstruct what it implies.
What is CAGR?
It stands for Compound Annual Growth Rate.
It is the rate at which investment grows on average annually, over a certain period, and with the assumption that profits were reinvested at the end of each year.
In simple terms, it is the rate telling you how much your investment would have grown each year had it compounded steadily at that rate on an annual basis.
Why is CAGR Important?
It eliminates the effects of volatility in returns.
It gives one growth rate by which different investments can be compared.
It helps in setting a benchmark for realistic growth expectations.
Suppose your investment grew at different rates every year — CAGR simplifies that into one rate, uniform for every year.
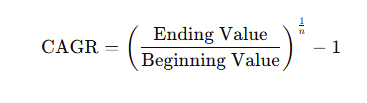
CAGR Formula
The formula for CAGR is:
Where:
Beginning Value = Value of the investment at the start
Ending Value = Value of the investment at the end
n = Number of years
How to Calculate CAGR (Example)
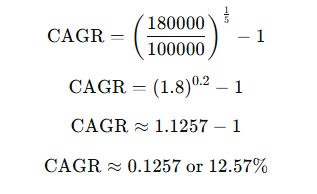
Let’s say you invested ₹1,00,000 in a mutual fund. After 5 years, it grew to ₹1,80,000.
Your investment grew at an average annual rate of about 12.57% over the 5 years.
Things to Remember About CAGR
CAGR assumes smooth growth — but real investments can be volatile.
It doesn’t reflect year-to-year fluctuations or market risks.
Useful for comparing long-term investments like stocks, mutual funds, or business revenues.
Interpreting CAGR Results
What does a high or low CAGR tell you?
High CAGR: Success! Your investment or business is growing fast and steady.
Low CAGR: The growth is slow or nonexistent. Maybe time for a fresh perspective.
Evenly comparing the CAGR across various assets or time can help determine which has been the best investment. But, always remember that the CAGR assumes growth to be smooth and continuous, which in reality, it generally is not. There can be instances of sudden dips in the market, and these could camouflage the picture.
Some professionals suggest that the CAGR is misleading if used alone. It does not measure fluctuations or risk. To get a full picture, use other metrics together with CAGR, for example, volatility or maximum drawdown.
Practical tips for effective use of CAGR
To get the most out of CAGR, follow all the below tips:
Always use CAGR in conjunction with other ratios like ROI, working margins, or debt ratios.
Use the trends of CAGR in projecting future growth while remaining cautious about excessively optimistic forecasts.
If sharing results, it is paramount to explain how CAGR was calculated to all stakeholders involved.
Always update the calculation of CAGR so that it will contain the most recent data, and thus, your analysis should remain relevant.
As you become more familiar with CAGR, you’ll spot opportunities and risks faster. It’s a simple number, but its insights run deep.
Final Thoughts
CAGR is a simple yet powerful tool that helps you understand how your investments have performed over time — as if they had grown at a steady rate. Whether you’re comparing mutual funds, stocks, or even your business’s sales growth, knowing how to calculate and interpret CAGR can make you a smarter investor!
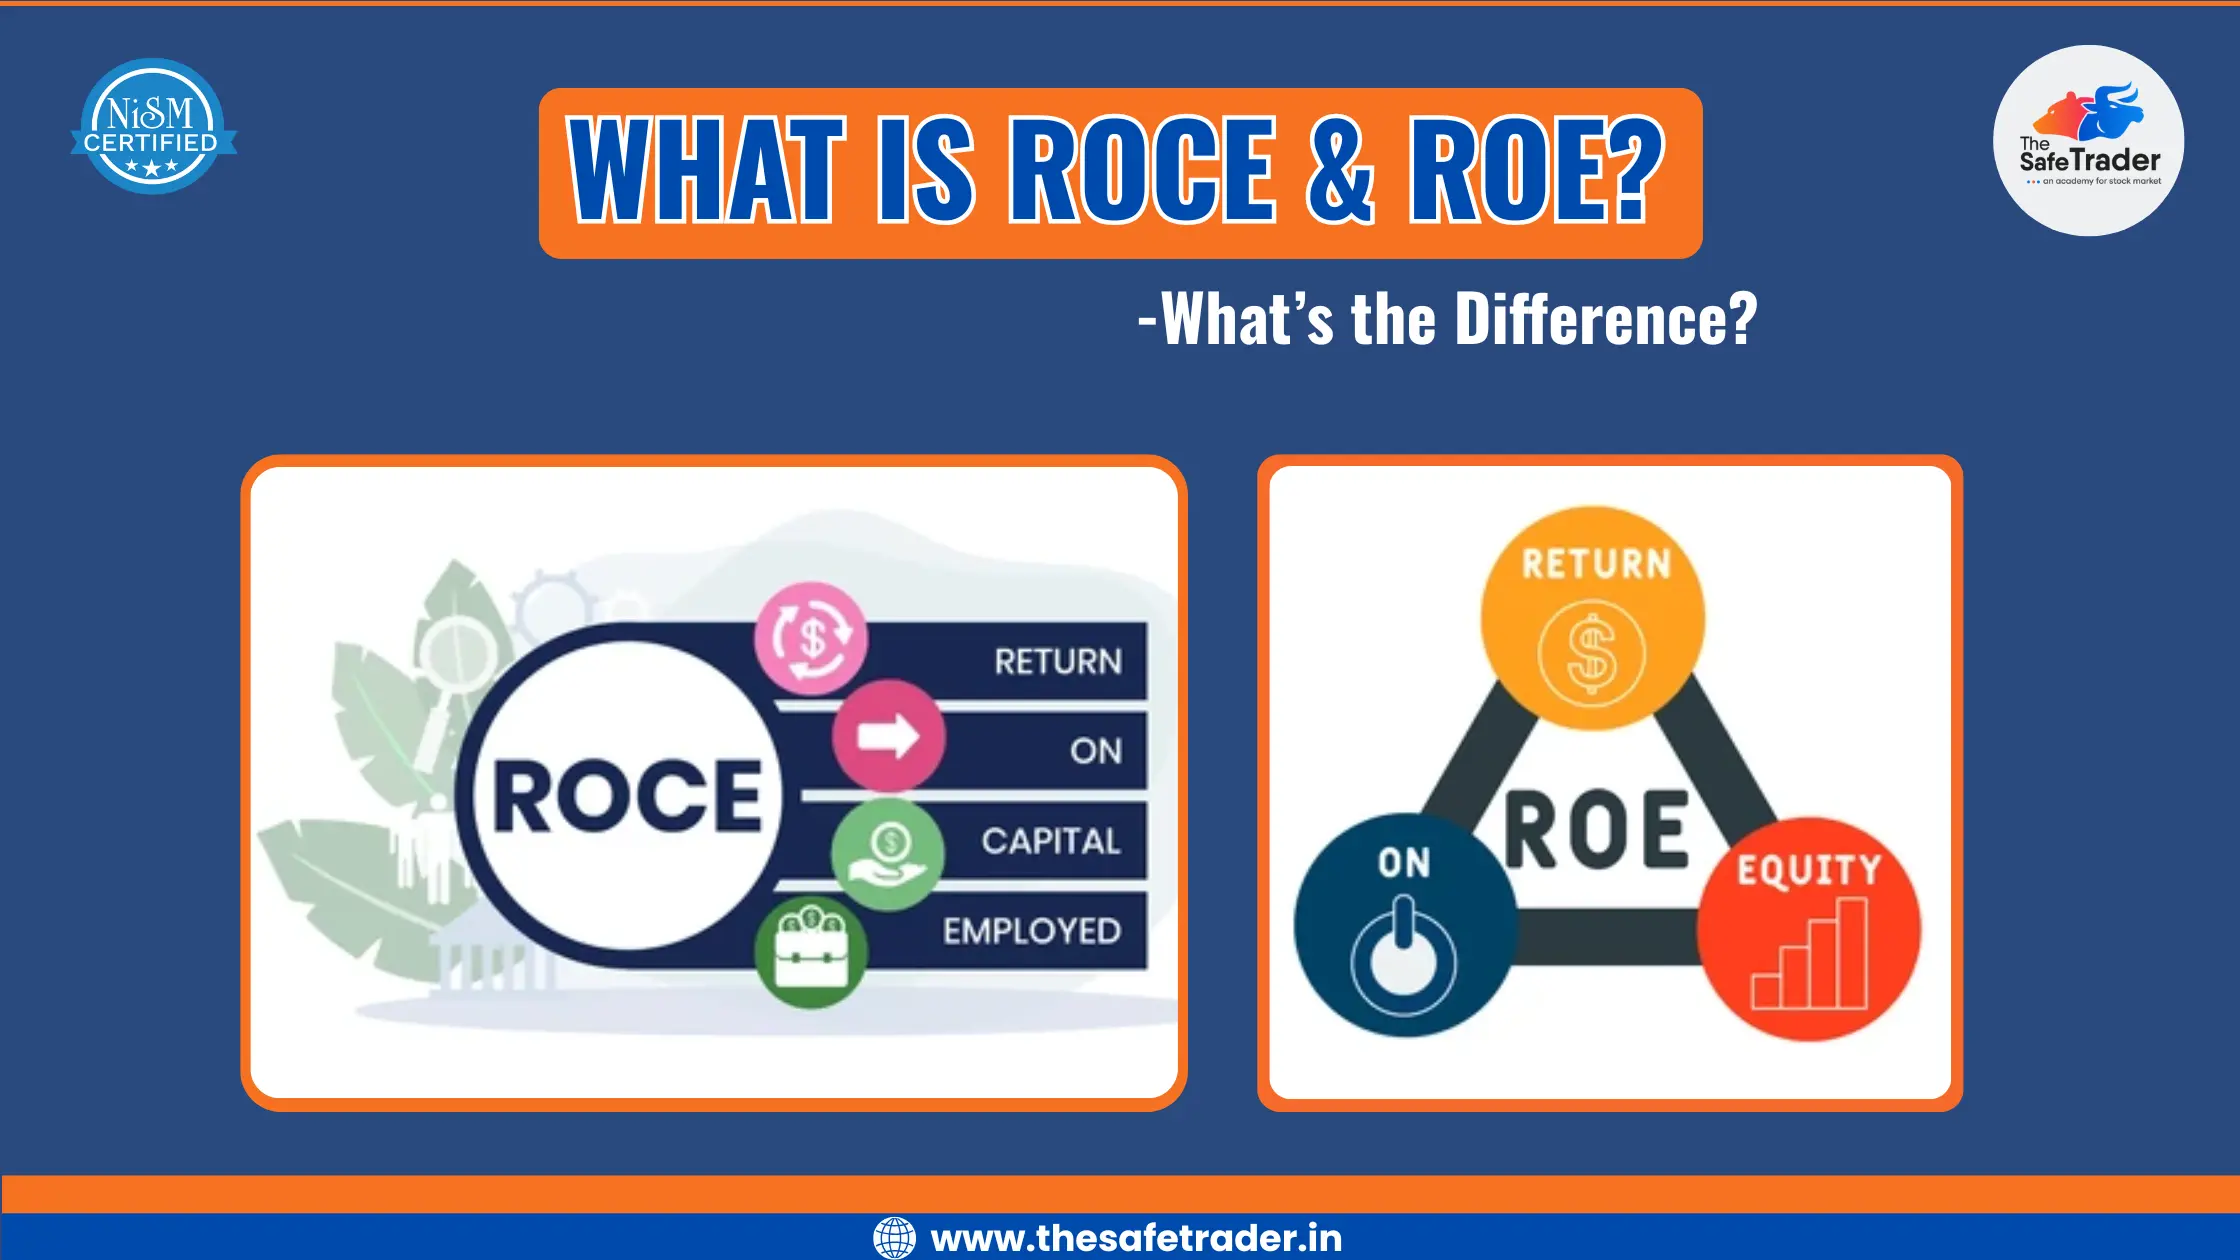
When it comes to evaluating the performance of a company, investors and analysts rely on key financial ratios to measure how efficiently the company generates profits from its resources. Among these, ROCE and ROE are two crucial metrics that provide valuable insights into how well a business is utilizing its capital and shareholders’ funds.
This blog explains various aspects of ROCE and ROE along with their methods of calculations, indicators, and the reasoning behind why an investor and a business owner need to be concerned about them.
What is Return on Capital Employed (ROCE)?
The capital employed is the sum total of debt and equity, and ROCE is a measurement of how good the business is in using its total capital to generate profits. It gives an idea of the amount of profit generated for every rupee (or dollar) of capital employed in the business.
ROCE formula is:
Where:
EBIT is the operating profit of the company
Capital Employed = Total Assets – Current Liabilities (or Shareholders’ Equity + Debt)
What does ROCE indicate?
A higher ROCE means the company is generating better returns on the capital invested in the business.
It helps compare companies that have different levels of debt and equity, making it useful in industries where companies borrow significantly.
ROCE is ideal for assessing capital-intensive businesses like manufacturing, utilities, or telecom.
What is Return on Equity (ROE)?
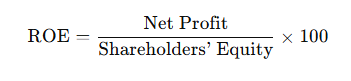
Return on Equity measures the profitability of a firm in relation to shareholders’ equity. In simpler terms, it indicates the efficiency with which the company is using shareholders’ capital to generate net profit.
Formula for ROE:
Where:
Net Profit is the profit made after tax.
Shareholders’ Equity consists of share capital and reserves (retained earnings).
What does ROE indicate?
If a company has a very high return on equity, it implies that it earns fairly good profits from the funds that shareholders have placed in it.
It helps investors to see how well their capital has been utilized.
It would be more important when comparing companies within the same industry or sector.
ROCE vs ROE: What’s the Difference?
Aspect
ROCE
ROE
Measures
Returns on total capital (debt + equity)
Returns on shareholders’ funds
Useful for
Evaluating capital efficiency overall
Evaluating shareholder returns
Includes debt?
✅ Yes, it considers debt and equity
❌ No, only equity
Best for
Capital-intensive companies
Asset-light or equity-heavy companies
Example: Imagine two companies:
Company A has high debt but uses it effectively to generate profits.
Company B has no debt and relies only on equity.
ROCE will highlight how well Company A manages its borrowed and owned capital.
ROE will show how well Company B is rewarding its shareholders.
Why Should Investors Track ROCE and ROE?
Assess management efficiency – Both ratios reveal how well the management is Assess management efficiency – Both are indicators of how well management is utilizing their resources.
Identify strong businesses – Consistently higher ROCE and ROE show narrow or wide competitive advantages (or “moats”).
Compare industry peers – Useful in comparing companies within one sector.
Note: Sometimes, a sky-high ROE is because a company has taken too much debt and thereby lowered its equity. It might be a sort of artificial inflation of the ROE. That’s why ROCE and ROE must be looked at together.
Key Takeaways
ROCE indicates how well a company is generating profits from all its capital (debt + equity).
ROE indicates how well a company generates profits for its shareholders.
Both are great tools for investors to analyze how profitable or efficient a company is.
These ratios are better analyzed if compared with industry averages and the company’s past performance.
Conclusion
In fact, both ROCE and ROE are significant indicators of the financial scorecard of a company. ROCE looks at returns generated in respect of all sources of capital, whereas ROE analyzes shareholder wealth creation. From an investor perspective, analyzing both would yield a much better insight into how a company is faring with respect to its resource deployment and value creation.
If you are interested in Stock Investing, you have probably heard of the P/E Ratio. It is one of the most widely used tools for evaluating whether a stock’s price is fair enough. But what exactly is it? We will break it into simpler terms so that anyone -even a beginner can understand.
What Does P/E Ratio Tell You?
The Price-Earnings Ratio is an indicator that reflects how much the market is willing at present to pay for ₹1 worth of a company’s earnings.
👉 A higher P/E means investors expect higher growth and are willing to pay more for future earnings. 👉 A lower P/E could mean the stock is undervalued — or that the company’s growth prospects aren’t great.
In brief:
➡The P/E ratio depicts a measure of investor confidence and of future expectations about the profitability of a company.
How to Calculate P/E Ratio?
Where:
Current Share Price is the stock price you see on your trading platform.
Earnings Per Share (EPS) is calculated by dividing net earnings by the total number of outstanding shares.
✅ This means investors are paying ₹20 for every ₹1 of the company’s earnings.
How Do Investors Use the P/E Ratio?
Valuation Check – Is it correctly priced concerning its earnings?
Peer Comparison – How does it fare against competitors or industry averages?
Growth Signal – Does the market expect a high growth (high P/E) or a low growth (low P/E)?
Example:
Nifty IT Sector companies may have a slightly higher average P/E than Nifty PSU Bank companies because investors expect faster growth from IT companies.
Types of P/E Ratios to Know
Type
What it Means
Trailing P/E
Based on past 12 months’ actual earnings.
Forward P/E
Based on forecasted earnings for the next year.
➡ Trailing P/E tells you what has happened. ➡ Forward P/E tells you what might happen.
P/E Ratio: Points to Remember
Industry matters: A high P/E in FMCG may be normal, while the same in manufacturing could possibly be considered an overvaluation.
Growth companies vs mature companies: Start-up or growth companies usually have high P/E ratios since investors expect quick earnings growth.
Don’t judge a stock only on P/E: A stock could have a low P/E because of business risks, management issues, or slowing demand.
P/E Ratios in Various Scenarios
Company A (P/E 50): High P/E because the market expects earnings to rise sharply.
Company B (P/E 8): Low P/E could mean undervalued or it could mean trouble ahead.
Limitations of the P/E Ratio
Does not consider debt: Suppose two companies with the same P/E have varying financial health; the one with a lot of debt may be at a disadvantage.
Skewed by abnormal earnings: Rare profits or lots can skew the EPS, and hence P/E.
Not useful when companies are losing money: If earnings are negative, P/E will either just be negative or become meaningless.
There is a sector bias: Different sectors naturally have different average P/E levels, so comparison across sectors can be misleading.
How to Effectively Use P/E?
Compared to peers: Do not look at a company’s P/E in isolation. Look at all the companies that belong in the same industry.
Combine with other ratios: Look at debt equity, price-to-book, ROE, etc.
Study the trend: Is the P/E increasing over time, or is it falling? This will indicate how the market perception is changing.
Real-Life Analog: The Indian Stock Market Interface
Infosys may trade at a higher P/E than Coal India because the IT sector is expected to grow faster and has better profitability.
PSU stocks may trade at a lower P/E as investors may see them as slower-growth or riskier bets.
Final Thoughts
The P/E ratio is like a quick health check of a stock’s valuation. But remember:
A high P/E doesn’t always mean expensive — it could mean growth. A low P/E doesn’t always mean cheap — it could mean trouble.
Always look at the bigger picture: growth prospects, debt, management quality, and industry trends.